
[Updated Sept 27, 2023 with the Power BI Field Finder V2]
TLDR: The Power BI Field Finder is a standalone pbix file you can download and hook up to your reports and data model to analyze where fields are used in reports and the data model to help you see the impact of changes to your data model and provide information to help clean up your data model by removing tables, columns, and measures that aren’t being used. Full instructions are below.
Originally posted on PowerBI.tips: https://powerbi.tips/2020/01/power-bi-field-finder/. If you haven’t yet, be sure to check out PowerBI.tips for all kinds of wonderful Power BI content!
Download (and contribute to) the Field Finder at https://github.com/stephbruno/Power-BI-Field-Finder
Latest Field Finder Updates:
- 2023/09/27
- Added support for connecting to a data model to compare all data model fields with the fields used in visuals and filters.
- Changed from analyzing a single file to allowing for all files under a folder.
- Fixed issues with column names with special characters.
- 2020/11/16 – Replaced the old HTML viewer with the new one by Daniel Marsh-Patrick (https://appsource.microsoft.com/en-us/product/power-bi-visuals/WA200001930). Thanks to Laura Graham-Brown’s presentation of SVG Images for pointing me in the right direction. Also incorporated Ried Haven‘s suggestion of a tooltip on the page thumbnails and included the PowerBI.tips page backgrounds.
The Problem
If you’re like me, building a data model in Power BI is an iterative process. Sometimes you have to try out different ways of writing measures before you hit on the one that’s right. You end up with temporary measures that don’t actually end up being used in visuals. You may also pull in more columns than you might end up needing, just in case. When you’ve finally finished your masterpiece with measures and visuals, there are probably quite a few that you don’t need. Two problems with this are that having extraneous columns and measures (1) can slow down your model and (2) can make it more difficult to maintain. You may also want to know where on reports a change to a measure will have an impact.
The Solution
The problem this led me to was that I had no easy way of finding out where columns and measures were used in the visuals of reports. I could click on each separate visual and see what elements it used, but I couldn’t go the other way and click on a data element to see where it was used in visuals. In researching the existing Power BI utilities, I learned a lot about how to improve my data models, but I couldn’t find anything that provided the ability to find where exactly data elements were used in reports. So I decided to try to build one myself. Based on the incredibly informative blog posts of Gilbert Quevauilliers, Reza Rad, Jese Navaranjan, Imke Feldman, and David Eldersveld, among others, I was able to create a tool that met some of my needs. Hopefully it will help you, too! (Note: the Field Finder does not show you the list of unused fields and measures. For a great tool to give you that info, please use Imke Feldman’s Power BI Cleaner. Matt Allington provides a helpful write-up for it as well.)
You can download the Field Finder here: https://github.com/stephbruno/Power-BI-Field-Finder
This provides downloads of both the pbix file and the template (pbit) file. If you want to use the tool as-is, just use the template. If you’d like to see how it works or make some tweaks of your own, then use the pbix file.
Setting up the Field Finder
- Get the server and database of your data model. You can either use a local pbix file or connect to a published dataset in a Power BI (Fabric) Premium workspace. I’ll show you how to get them for both of these choices.
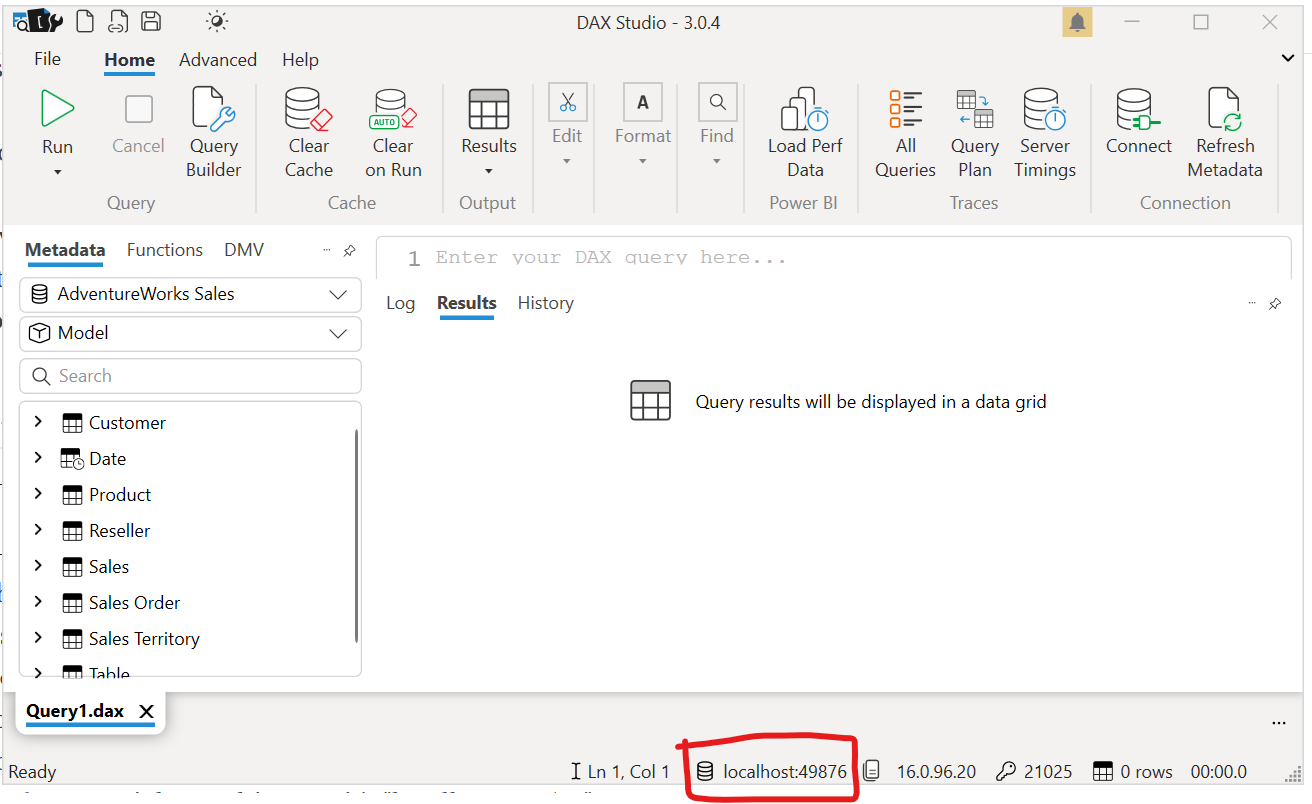
- For a dataset in a local pbix file, first make sure the file is open. Then connect DAX Studio to the pbix file through the External Tools in the ribbon. Once connected, you can find the server in the bottom right. In this case, it’s “localhost:49876.”
Next, right-click on the dataset name on the left side, and choose “Copy Database Id.” This will be in the form of a long guid. You can see in the image below that a log message appears letting you know that you copied the database Id. Make sure you have both the server and the database handy to enter as parameters in the Field Finder.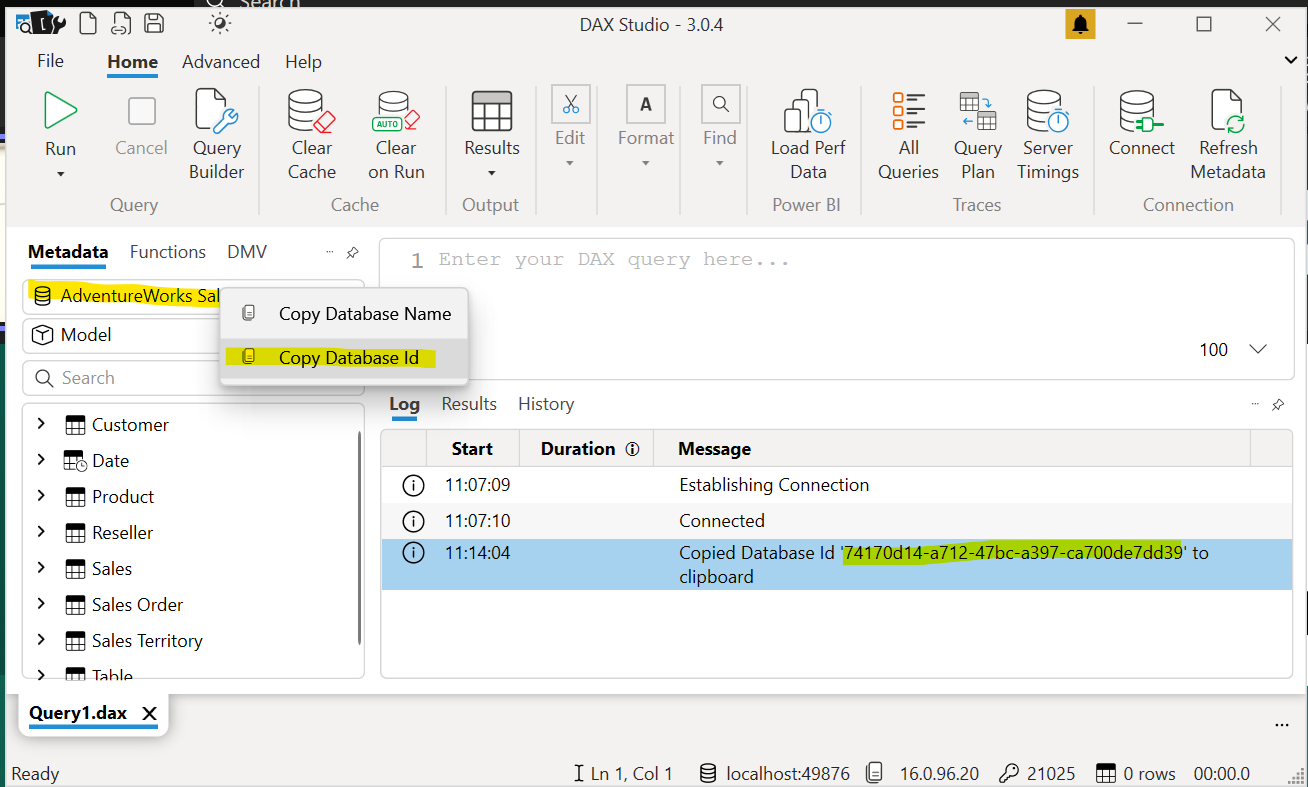
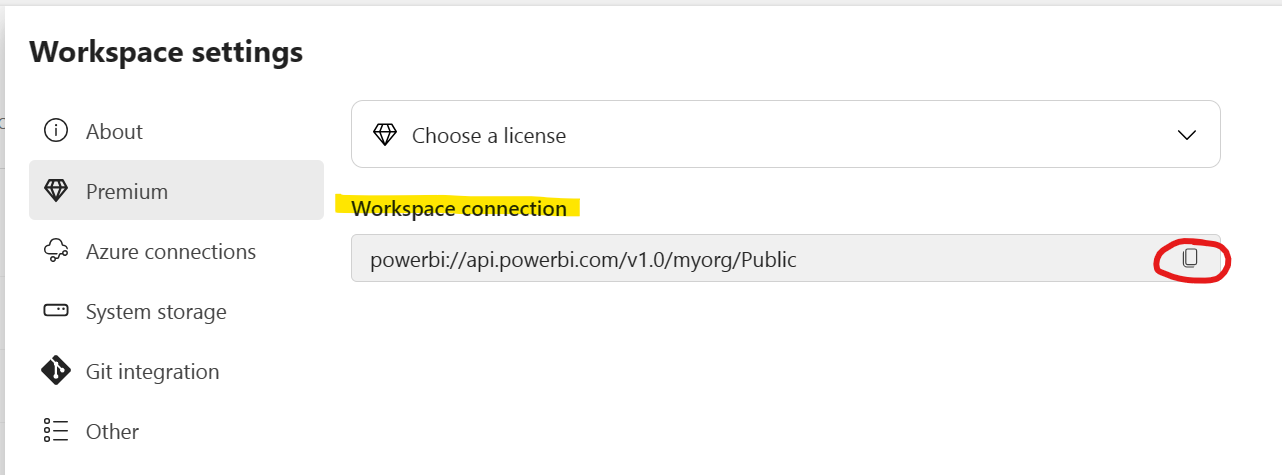
- For a dataset published in a Power BI Premium workspace, the server is the Workspace URL and the database is the dataset name. To get the Workspace URL, go to the Workspace Settings in the Power BI Service in the workspace where your dataset is published. You can copy the Workspace URL from there.
The database name is just the name of the dataset. If you have any trouble, verify that you are able to connect to the dataset with DAX Studio. Once connected, you can also copy the database name from there by right-clicking on it. Make sure you have the server and database ready to copy in as parameters for the Field Finder.
- For a dataset in a local pbix file, first make sure the file is open. Then connect DAX Studio to the pbix file through the External Tools in the ribbon. Once connected, you can find the server in the bottom right. In this case, it’s “localhost:49876.”
- Double-click the “Power BI Field Finder.pbit” file wherever you downloaded it. Or open up the pbix version, if you prefer.
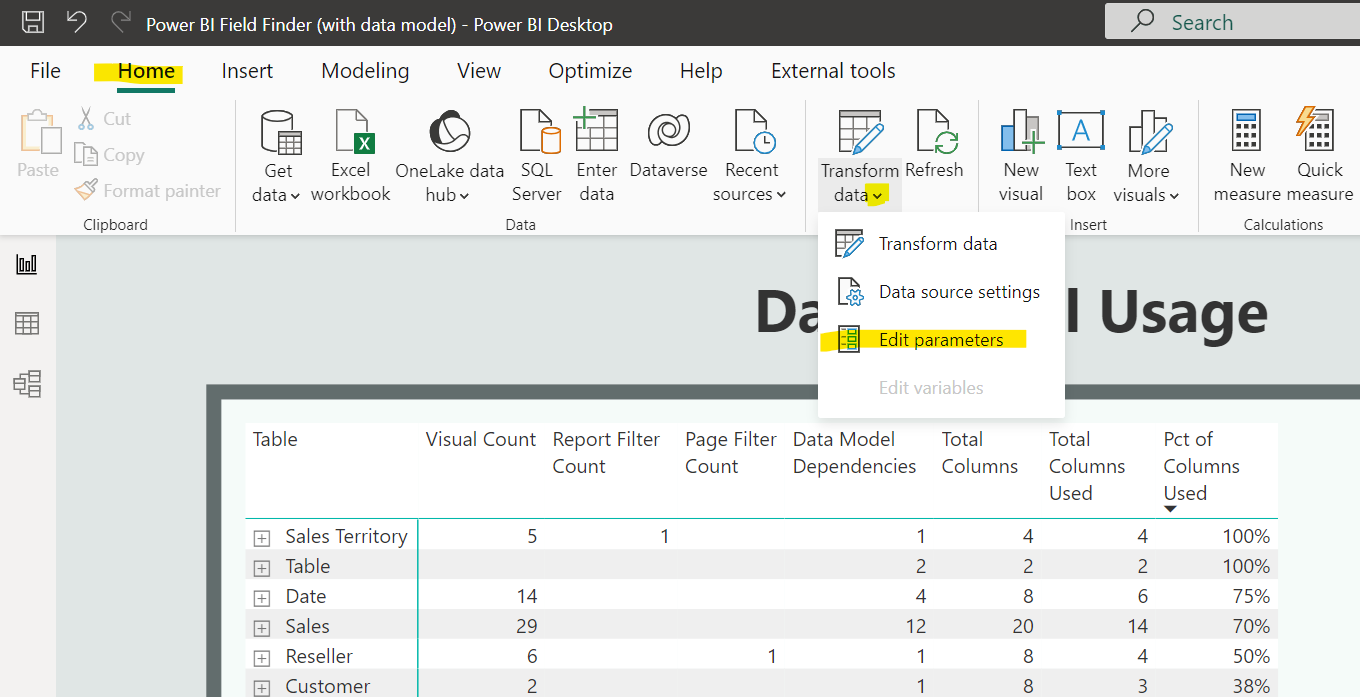
- When the file opens, you’ll be prompted to enter values for the input parameters. If using the pbix version, go to the Home tab of the ribbon, click on the down arrow under “Transform data”, and select “Edit parameters.”
- Reports folder path: This is the path to a folder where your reports files are. It will also look in subfolders. For example, if you have reports in a folder on the C drive called “reports”, the path will be “C:\reports”. The Field Finder will analyze all pbix files and all report.json files. If you’re using report.json files through saving as a pbip, be sure that they are under a folder with the report’s name (this is the default when saving a pbix file as a pbip, so no changes are necessary if you’re saving that way).
- Data model server: the name of the server from the previous step.
- Data model database: the name of the database from the previous step.
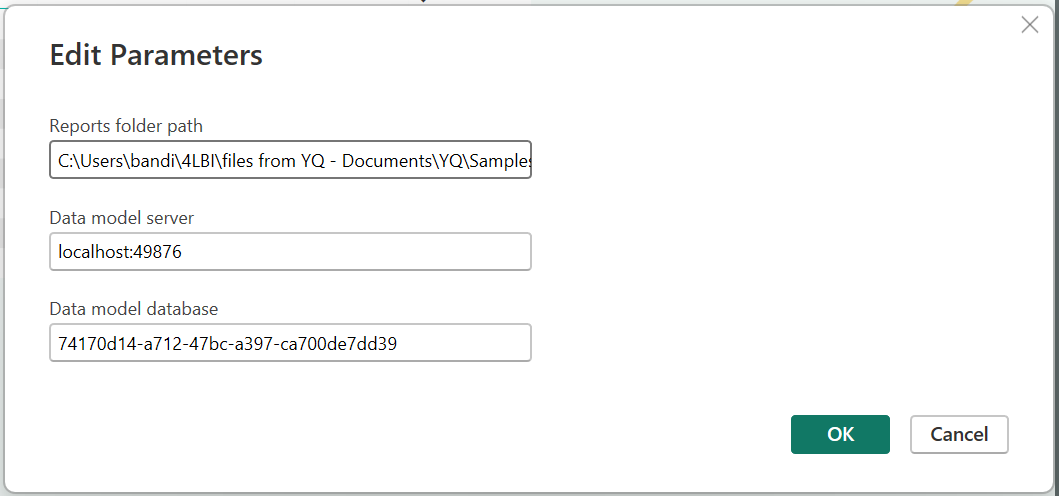
- Click the “Load” button. The file will start importing the layout information for your reports.
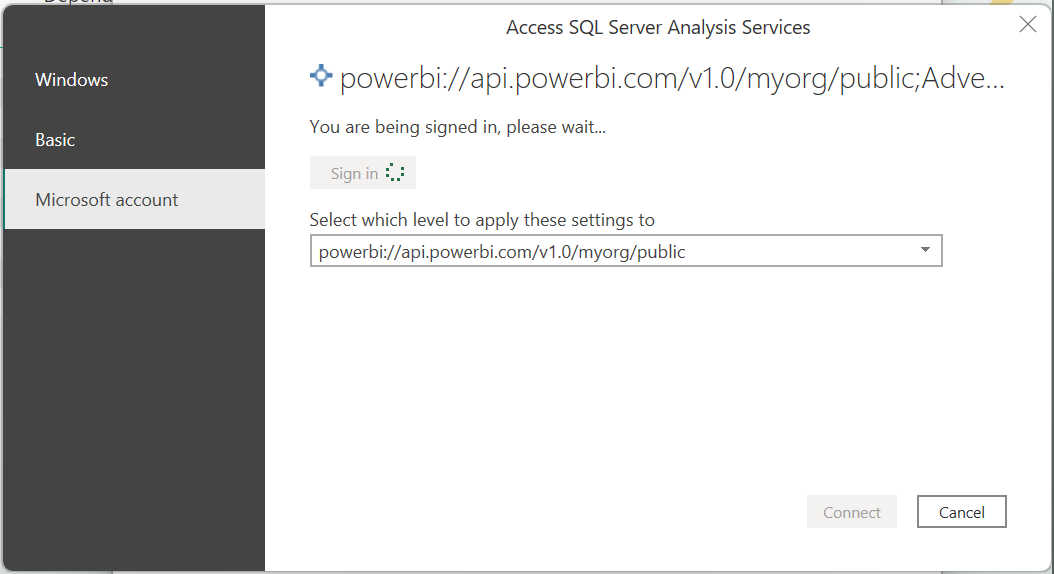
- You’ll have to authenticate if you’re connecting to a model in the service, so enter your credentials in the Microsoft account section and click Connect.
- Note that every time you change the data model parameters, you’ll be running new native queries against the analysis services engine, so will be prompted to give the okay a bunch of times by clicking the “Run” button.
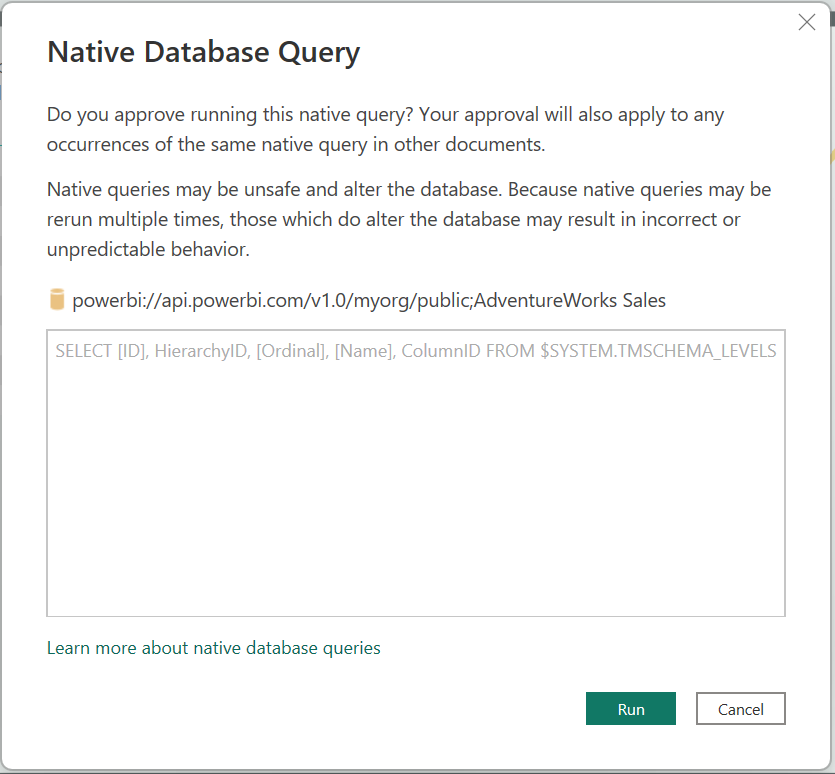
If you don’t want to have to do this every time, you can turn it off in the Global Security section of the Options (click File – Options and settings – Options):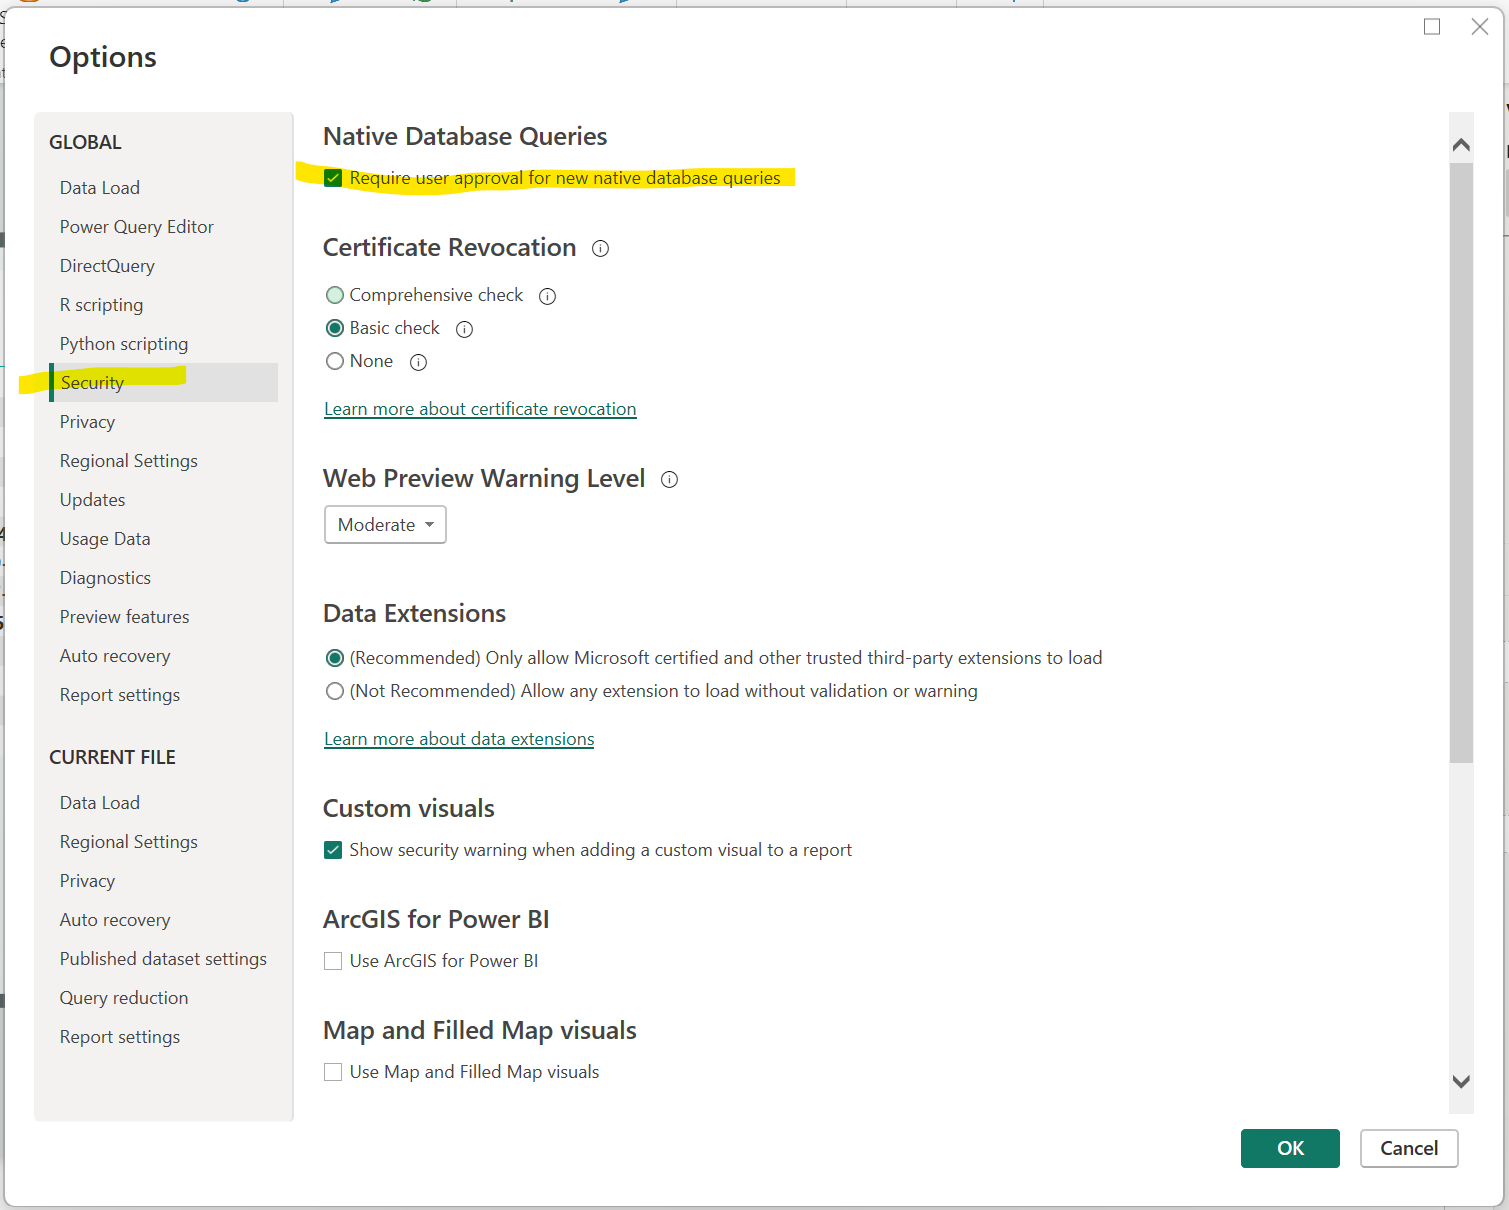
- You’ll have to authenticate if you’re connecting to a model in the service, so enter your credentials in the Microsoft account section and click Connect.
- After loading the information, you’ll see five tabs.
- The first tab (Instructions) provides basic information and instructions.
- The second tab (Data Model) provides all of the tables, columns, and measures in the data model (plus any additional ones created in the reports) along with a count of model dependencies (relationships, measures, calculated columns) and report dependencies.
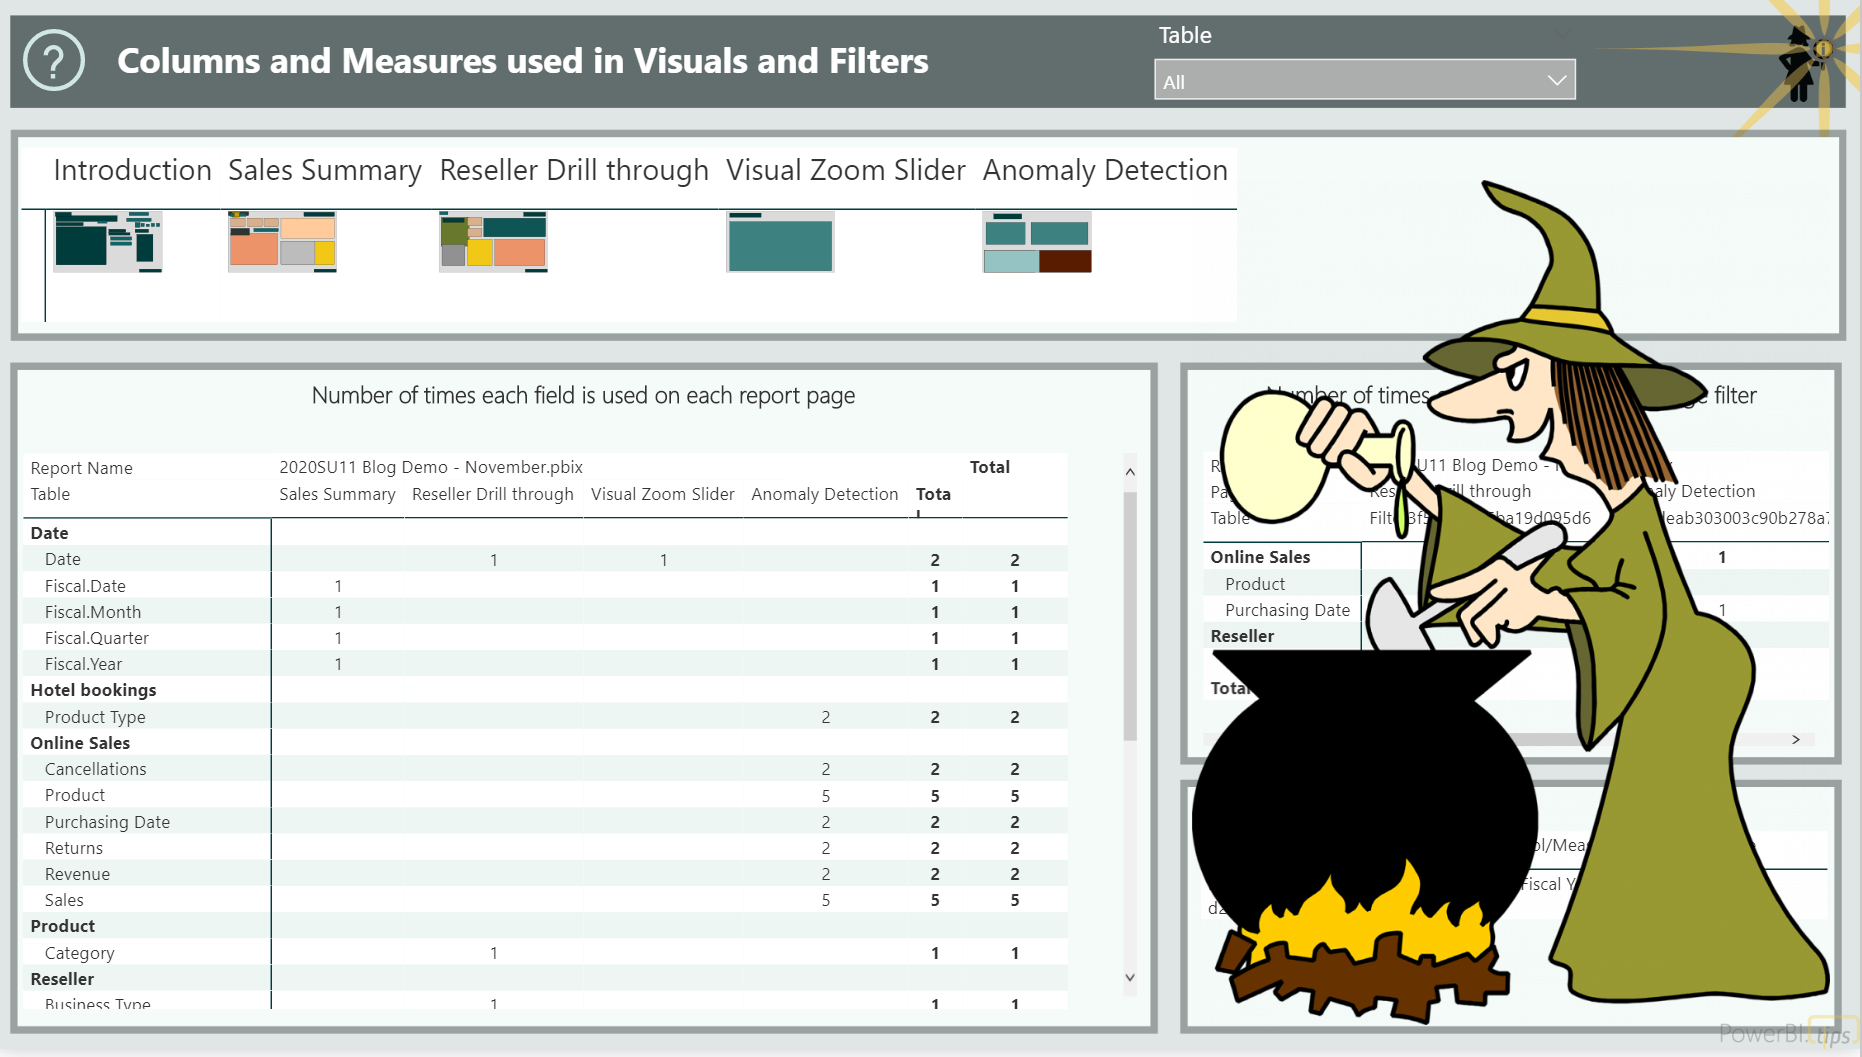
- The third tab (Columns and Measures) provides an overview of all pages of your report
- The fourth tab (Page Details) provides more detail on each page of your report
- The fifth tab (Helpful Resources) includes links of blog posts I used to make the tool
- First we can get an overall picture in the Data Model tab.
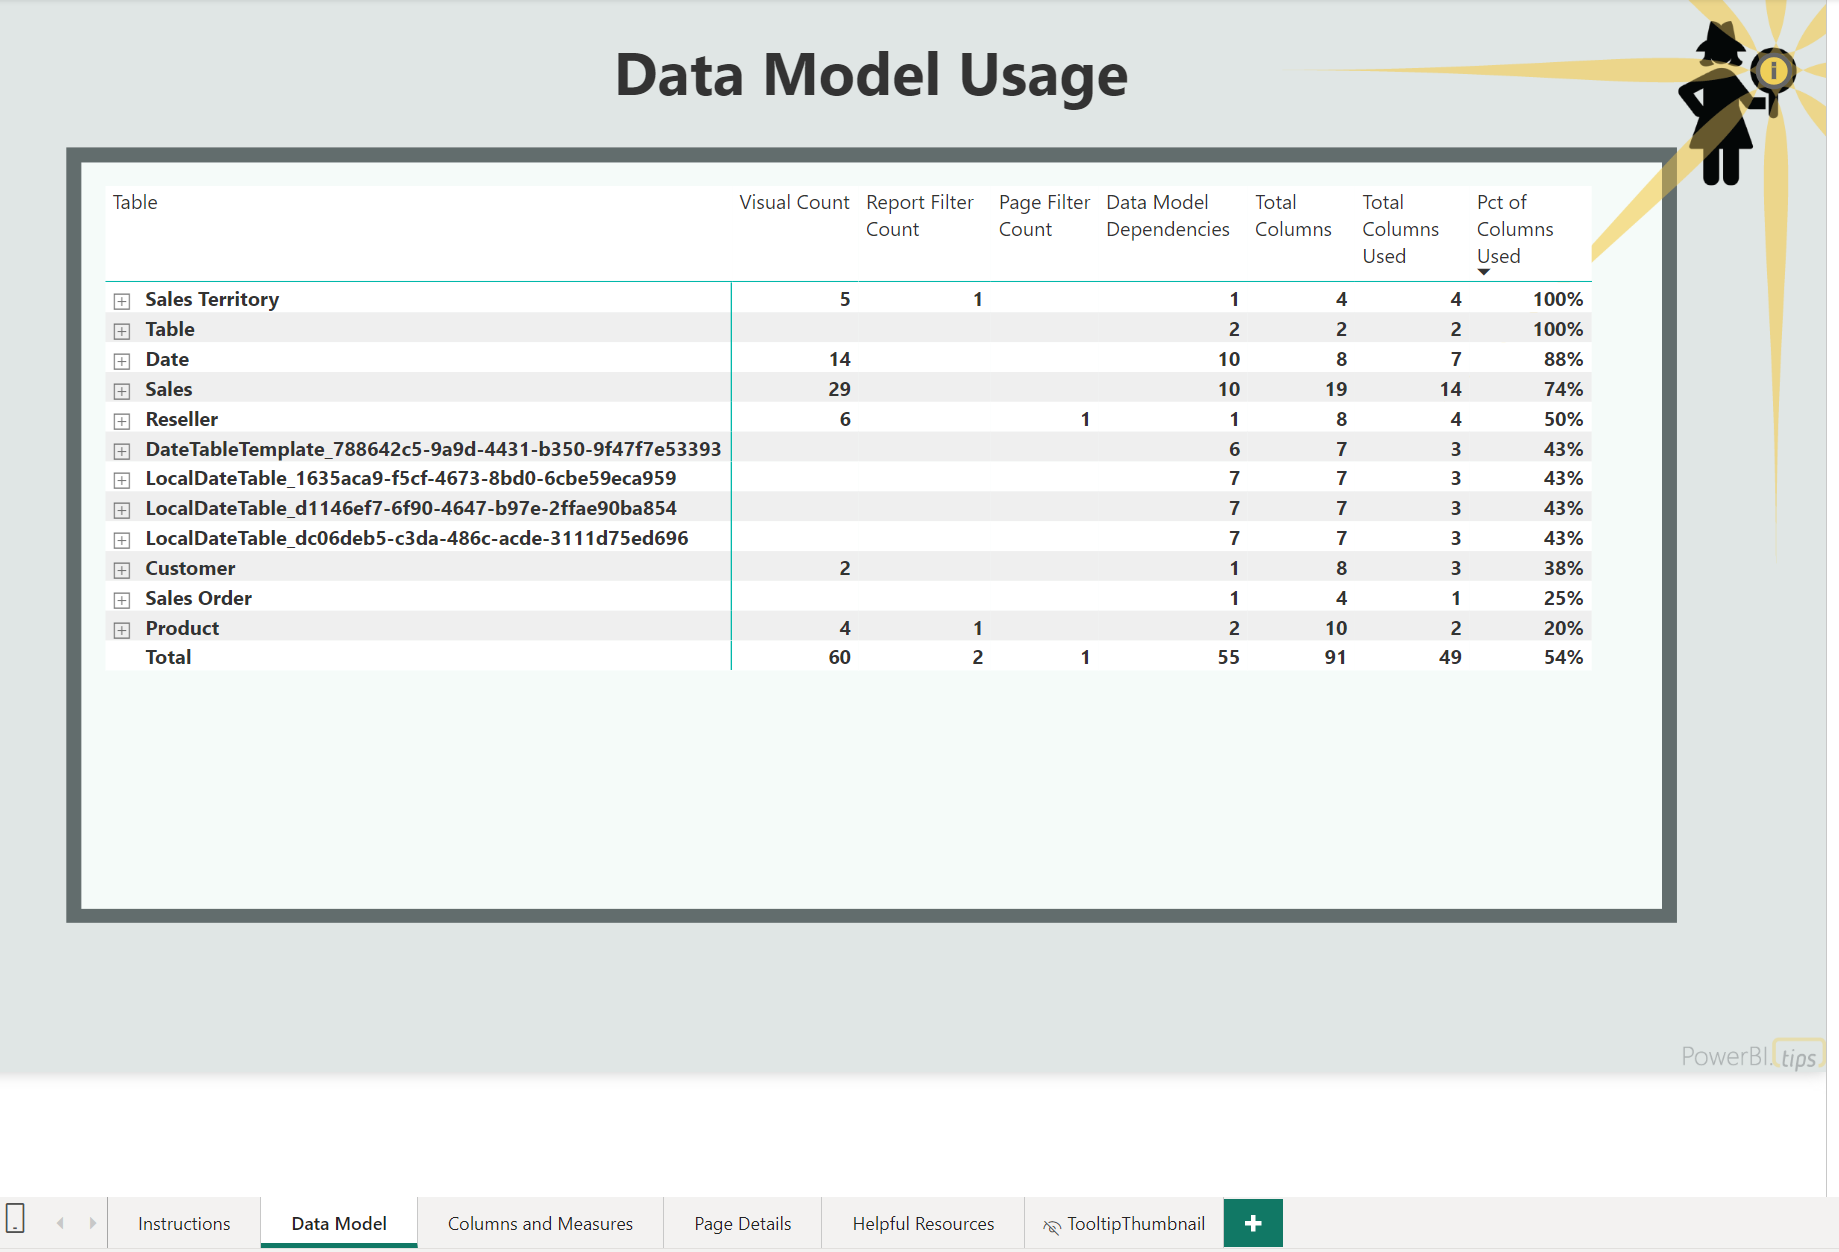
This tab provides a simple matrix showing you all of the tables and columns in the model, along with how many times they are used in page visuals, filters, and the data model itself. This should be your starting point if you are trying to clean up the data model by removing unnecessary tables, columns, and measures. As always, trust but verify. There could be other reports out there using your data model that you aren’t including in this analysis.
In the image above, I can see that this model has a bunch of date tables that I don’t want, and the Sales Order table isn’t used in any visuals and only has a relationship. That might be a good one to delete, for example. - Let’s look at the Columns and Measures tab:

On this tab, you’ll see a thumbnail along the top of each of the pages in your report. The types of visuals are color coded and the name of the page is above the thumbnail. The table on the bottom left gives you the number of times each column or measure is used on each page of the report. On the right you can also see the page level and report level filters using columns and measures.
Clicking on the thumbnail of a page will filter the tables below to show you exactly which elements are used on that page. Similarly, clicking on a column or measure name in the tables will filter the thumbnails above so you can quickly see which pages it’s used on. For example, clicking “Product Standard Cost” from the “Sales” table in the bottom left shows that it’s used in the “Sales Summary” and “Reseller Drill through” pages. The thumbnails cross-filter to just those pages and the visuals on those pages that use that field.

Or, clicking on just thumbnail for the “Anomaly Detection” page, you can see which columns and measures are used on the entire page.

- For more detail on a specific page, click on the “Page Details” tab.

The Page Details tab provides a bigger image of the visuals on the page, as well as more details on the types of visuals and what they’re using. You can select one of your pages with the slicer on the top. The Visuals Legend provides a color code of the type of visual used and the name of the visual. If you haven’t updated the name of your visual in the Selection Pane of your pbix file, you’ll get one of these long strings for the visual name that isn’t very helpful. You’ll also get the list of all the columns and measures used in the visuals as well as any page level filters.
For example, by clicking on “Sales” in the table in the bottom, I can see at a glance where the Sales field is used on the page. The image of the page also makes it easy for me to go to my pbix file and find exactly which visuals it’s used on.

- If you make changes to your reports or dataset, just save them and then refresh the Field Finder to get your updates.
- If you want to examine different files, all you need to do is change the parameters. To do that, go to “Transform data – Edit parameters” and enter the updated values.

I hope you find the Field Finder useful. Please let me know if you have any suggestions for future versions.
Many thanks to Seth and Mike of powerbi.tips for creating the improved visual layout of the Field Finder!
Double, double toil and trouble;
Fire burn and caldron bubble.
Comments
14 responses to “Power BI Field Finder”
LOVE IT! Seriously, it is really cool.
[…] Stephanie Bruno has updated a useful tool: […]
Does this work with connected to live dataset pbix as well??
I do think that it should, but I haven’t tested it! Try it out and let us know what you find!
First of all, many thanks for your tool PBI Field Finder, it is so precious work. Especially as an unofficial tool, made by enthusiasts.
Be able to locate relationships between measures, columns and pages, it is exactly what I need.
Just humble question – is it possible to show also measures and columns which are not used anywhere? Basically, with number of appearance = 0 . Really helpful for cleaning the report.
Hi Yaroslav! Stephanie recently updated the tool – it is now possible to find which fields aren’t being used!
Hi! Great tool. Can’t express how it was helpful. However, is it possible to show on “Columns and Measures” page columns and measures, that are NOT used in my report? With a number of presence is equal zero.
And again, thank you for tool!
Hi Rickie! Stephanie recently updated the tool, and now you CAN find columns and measures that aren’t used!
Oh my, Stephanie! I think this tool cuts my time spent on documentation and validation of developer work in half or more! Thank you so much!
Does the Field Finder allow to extract alias friendly name of a measure which has been assigned in a visual? I mean in a visual we can rename columns or measures and this new alias name shows up on a visual instead of measure/column genuine name.
I’m sure that information is in the underlying .json file somewhere, it’s just not being surfaced in the Field Finder. Let us know if you dig it up!
Hi!
I’m getting the following error when trying to use the .pbit:
The column ‘Level’ of the table wasn’t found
Does anyone know how to fix this?
I tried with 2 different .pbix files, and I also tried local and online.
Thanks
Hi Vitor! Looks like we’re communicating here and on Twitter 🙂 Please send me a message and we’ll see if we can get you sorted. For anyone else reading, my initial recommendation is to triple check that all of your parameters are correct.
[…] to know how you, too, can perform magic on your Power BI files? Read more about how to use the field finder and let us know your thoughts in the […]