
BLOG

Category: DataViz
-
Radar Chart Fun with SVGs – aka No Small Multiples No Problem!
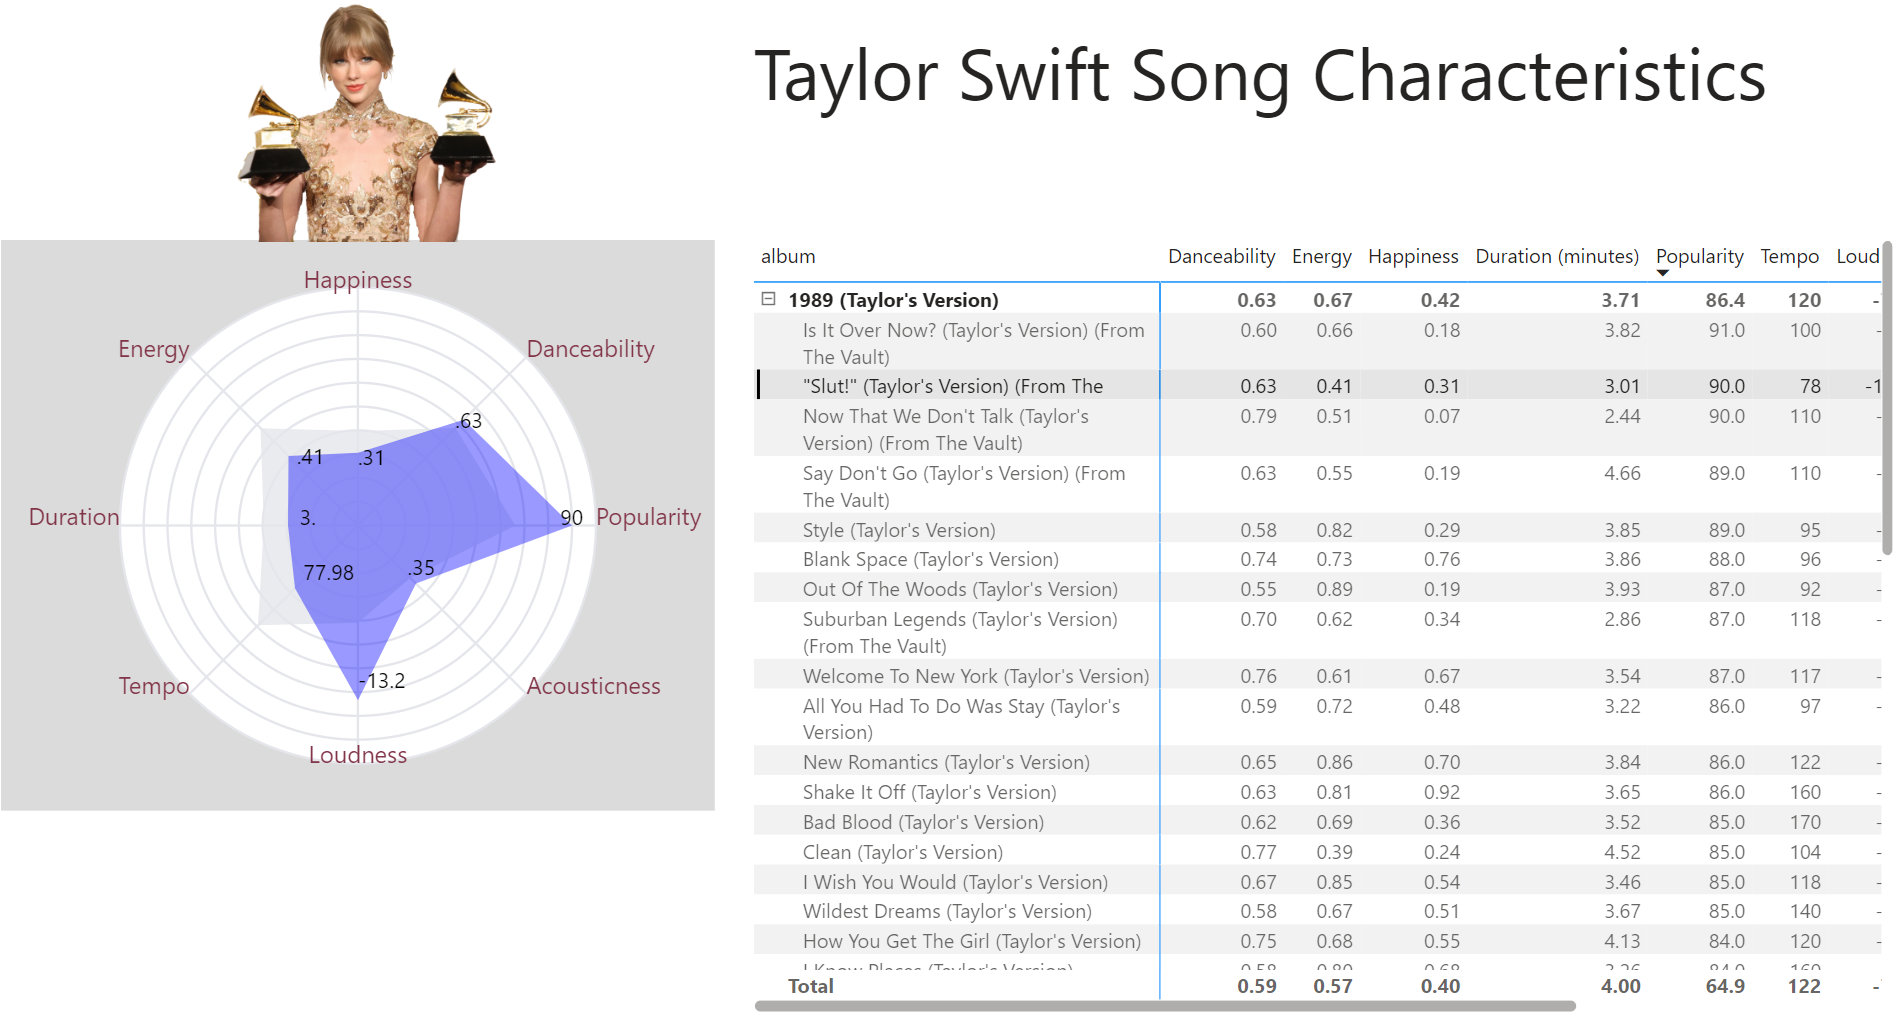
This week I got to be a guest contributor for the Workout Wednesday challenges for Power BI and used the opportunity to create a radar chart with SVG and display it in a matrix to simulate small multiples. You can download the solution file here. The Power BI core visuals are great and continually getting better. Top it off with custom visuals or go next level with Deneb and you can do almost anything! Another option I really like to add to the mix is SVG images, especially because you can put them into a table or matrix to create…
