
BLOG

Category: How To
-
Learn Fabric for FREE with an M365 Developer License
Are you interested in learning Power BI and/or testing out the brand new Microsoft Fabric (preview)? Do you want to do it outside of your corporate environment? We’ve got great news for you! You can sign-up for the Microsoft 365 Developer Program entirely for free, with no credit card needed! Our friends over at BIFocal made a video on this topic, so if you prefer to watch rather than read, check it out on YouTube! ***EDIT: As of May 21st, at Microsoft Build, a new trial experience was announced. Visit aka.ms/try-fabric to get started today with no credit card required!***…
-
When the Report Usage Metrics Report stops refreshing
Have you ever had a Usage Metrics Report just stop refreshing? At the bottom you’ll see a little message that tells you to check the credentials. But you don’t have access to the Usage Metrics Report dataset in the list of datasets in the workspace because it’s hidden! So even if you wanted to delete it and nicely ask it to start again, you can’t do it from the workspace. What can you do? Well, you can delete the Usage Metrics Report dataset with the Power BI Rest API. First, start a Windows PowerShell session. Make sure that you have…
-
DAX measures treating slicer selections with *and* instead of *or* behavior
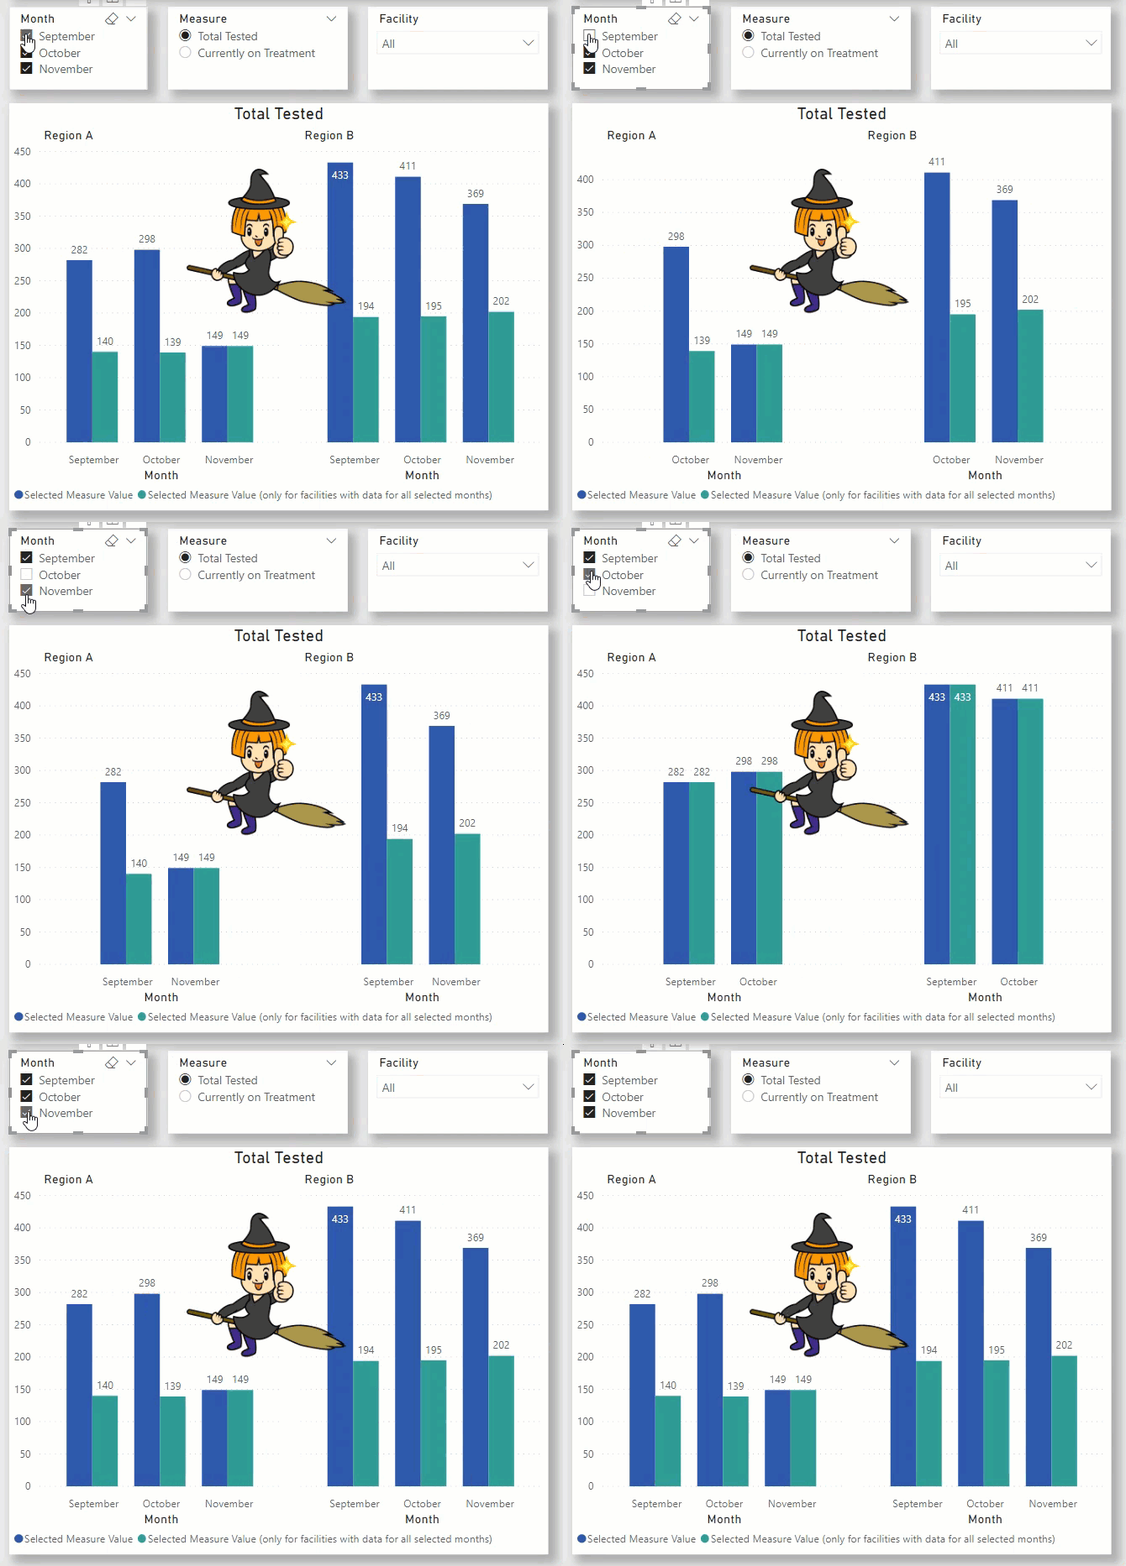
The general idea When using slicers in Power BI reports, multiple selections filter data with OR logic. For example, if you have a slicer with products and your visuals are displaying total number of invoices, then when “bicycles” and “helmets” are selected in the products slicer your visual will show the number of invoices that include bicycles OR helmets. But what if you need to have it instead only show the number of invoices that include bicycles AND helmets? Read on to find out how you can do just that with DAX. My specific problem You don’t need to read…
-
My favorite clean and simple way to combine csv files in Power BI
One of the unsung heroes to me in Power BI desktop (or Power Query in Excel) is how wonderfully simple it is to combine csv or Excel files from a folder. Maybe it’s not totally unsung, but I think it’s an everyday problem that many people have to deal with. It could easily be an entry point for many new users to see just how much easier Power Query can make their lives. As much as I appreciate how easy the tool allows us to automatically combine files without having to write any code, I never like all those extra…
-
Collect/Analyze/Automate with the Power Platform
Stephanie and I are data people. We excel at taking loads of unstructured data and making it intelligible (see what I did there?!). Do we want to be working with unstructured data? Is Excel a data collection tool? Or better yet, is Excel a database? In theory the answer to all of these questions is of course, NO. But in practice, we do the best with what we’re given and we move along. I know you do this too! The one place where I realized that I had a bit of control was in the data collection piece, which is…
-
Create an Interactive Legend in your Power BI Map
Mapping in Power BI can be super simple. Drop a field with a location in it, add a value, and you’re off to the races. Mapping in Power BI can also be challenging, and sometimes it takes a bit of trial and error to get a map close to what you want/need. This post is not about mapping options in Power BI – see the resource links below to learn it all! (seriously, visit these links – great content from great people) In this post I will show you how I created an interactive legend in Power BI that can…
-
Adding a row rank based on a different column with Power Query
Suppose you have two columns of data, one is something to group on and the other is something you could use to rank the rows. It might look something like this (grouping on Person, ranking based on Event Date): Now let’s say that you’d like to use Power Query to add a column that ranks each row based on Event Date, but groups it by Person, like this: To do this in the past, I have referred to Imke Feldman‘s response on this forum question more times than I can count. She has a wonderful little gif that shows exactly…
-
Using a Power BI perspective with Analyze in Excel
As of August 2020, perspectives can be used by your users when they are working with personalized visuals. Another place you may want to make use of the perspectives you define, though, is in Analyze in Excel.
