-
Mirroring Snowflake in Microsoft Fabric 101 – making the connection
 Read More
If you’re new to Snowflake and you need to mirror a Snowflake database in Microsoft Fabric, where do you begin? The steps are straightforward enough, but when trying something new, I often get tripped up by the basics. In this case, the configuration screen for mirroring. The documentation tells us to simply enter the server and warehouse, and provides some helpful information on where to find the details, but I prefer step by step instructions with pictures. If you do, too, then this post is for you. Server To find the value you’ll need for the Server, log in to…
 : Mirroring Snowflake in Microsoft Fabric 101 – making the connection
-
Radar Chart Fun with SVGs – aka No Small Multiples No Problem!
 Read More
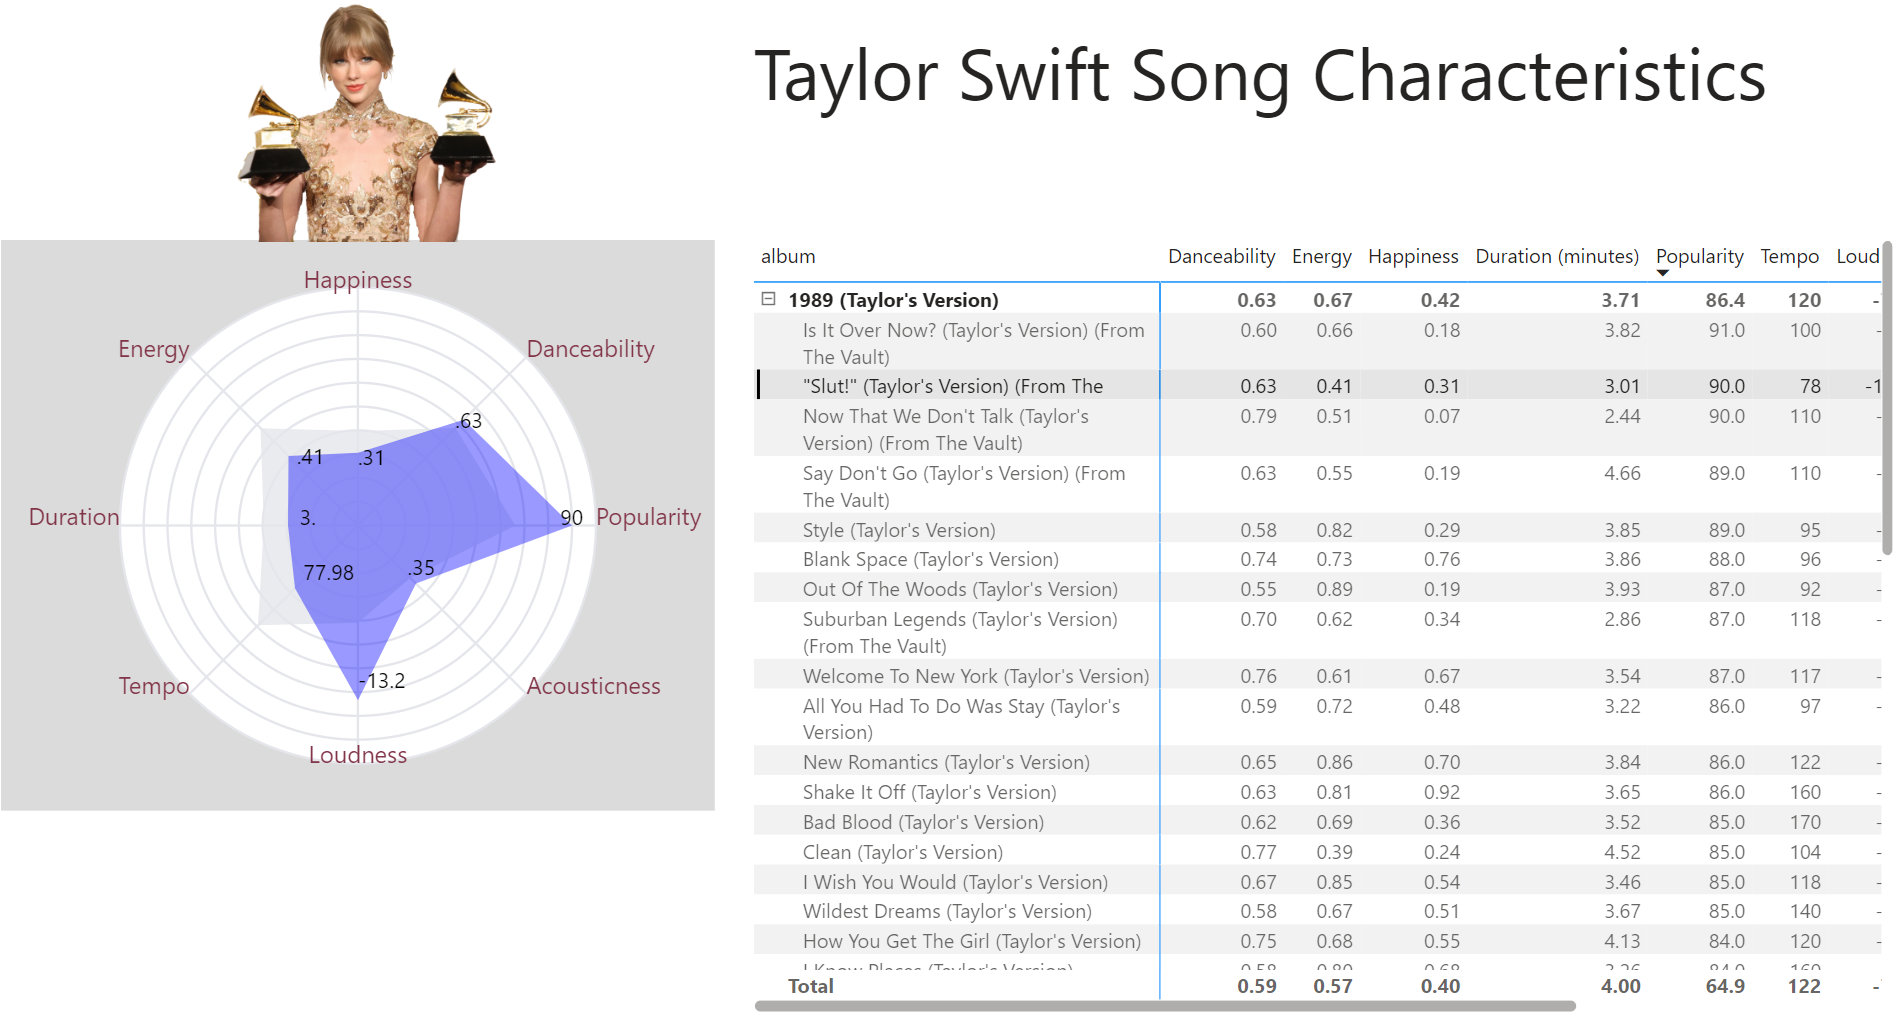
This week I got to be a guest contributor for the Workout Wednesday challenges for Power BI and used the opportunity to create a radar chart with SVG and display it in a matrix to simulate small multiples. You can download the solution file here. The Power BI core visuals are great and continually getting better. Top it off with custom visuals or go next level with Deneb and you can do almost anything! Another option I really like to add to the mix is SVG images, especially because you can put them into a table or matrix to create…
: Radar Chart Fun with SVGs – aka No Small Multiples No Problem!
-
Power BI Field Finder – new and improved!
Read MoreThe Power BI Field Finder is a standalone .pbix file you can download and hook up to your reports and data model to. The Field Finder helps you visually analyze where fields are used in reports. I just updated and released a ✨brand new version✨ of the Field Finder that can now connect to a data model to compare all data model fields with the fields used in visuals and filters. You can also use the Field Finder to help you see the impact of changes to your data model to help clean up your data model by removing tables,…
: Power BI Field Finder – new and improved!
-
Power BI Licensing Calculator
 Read More
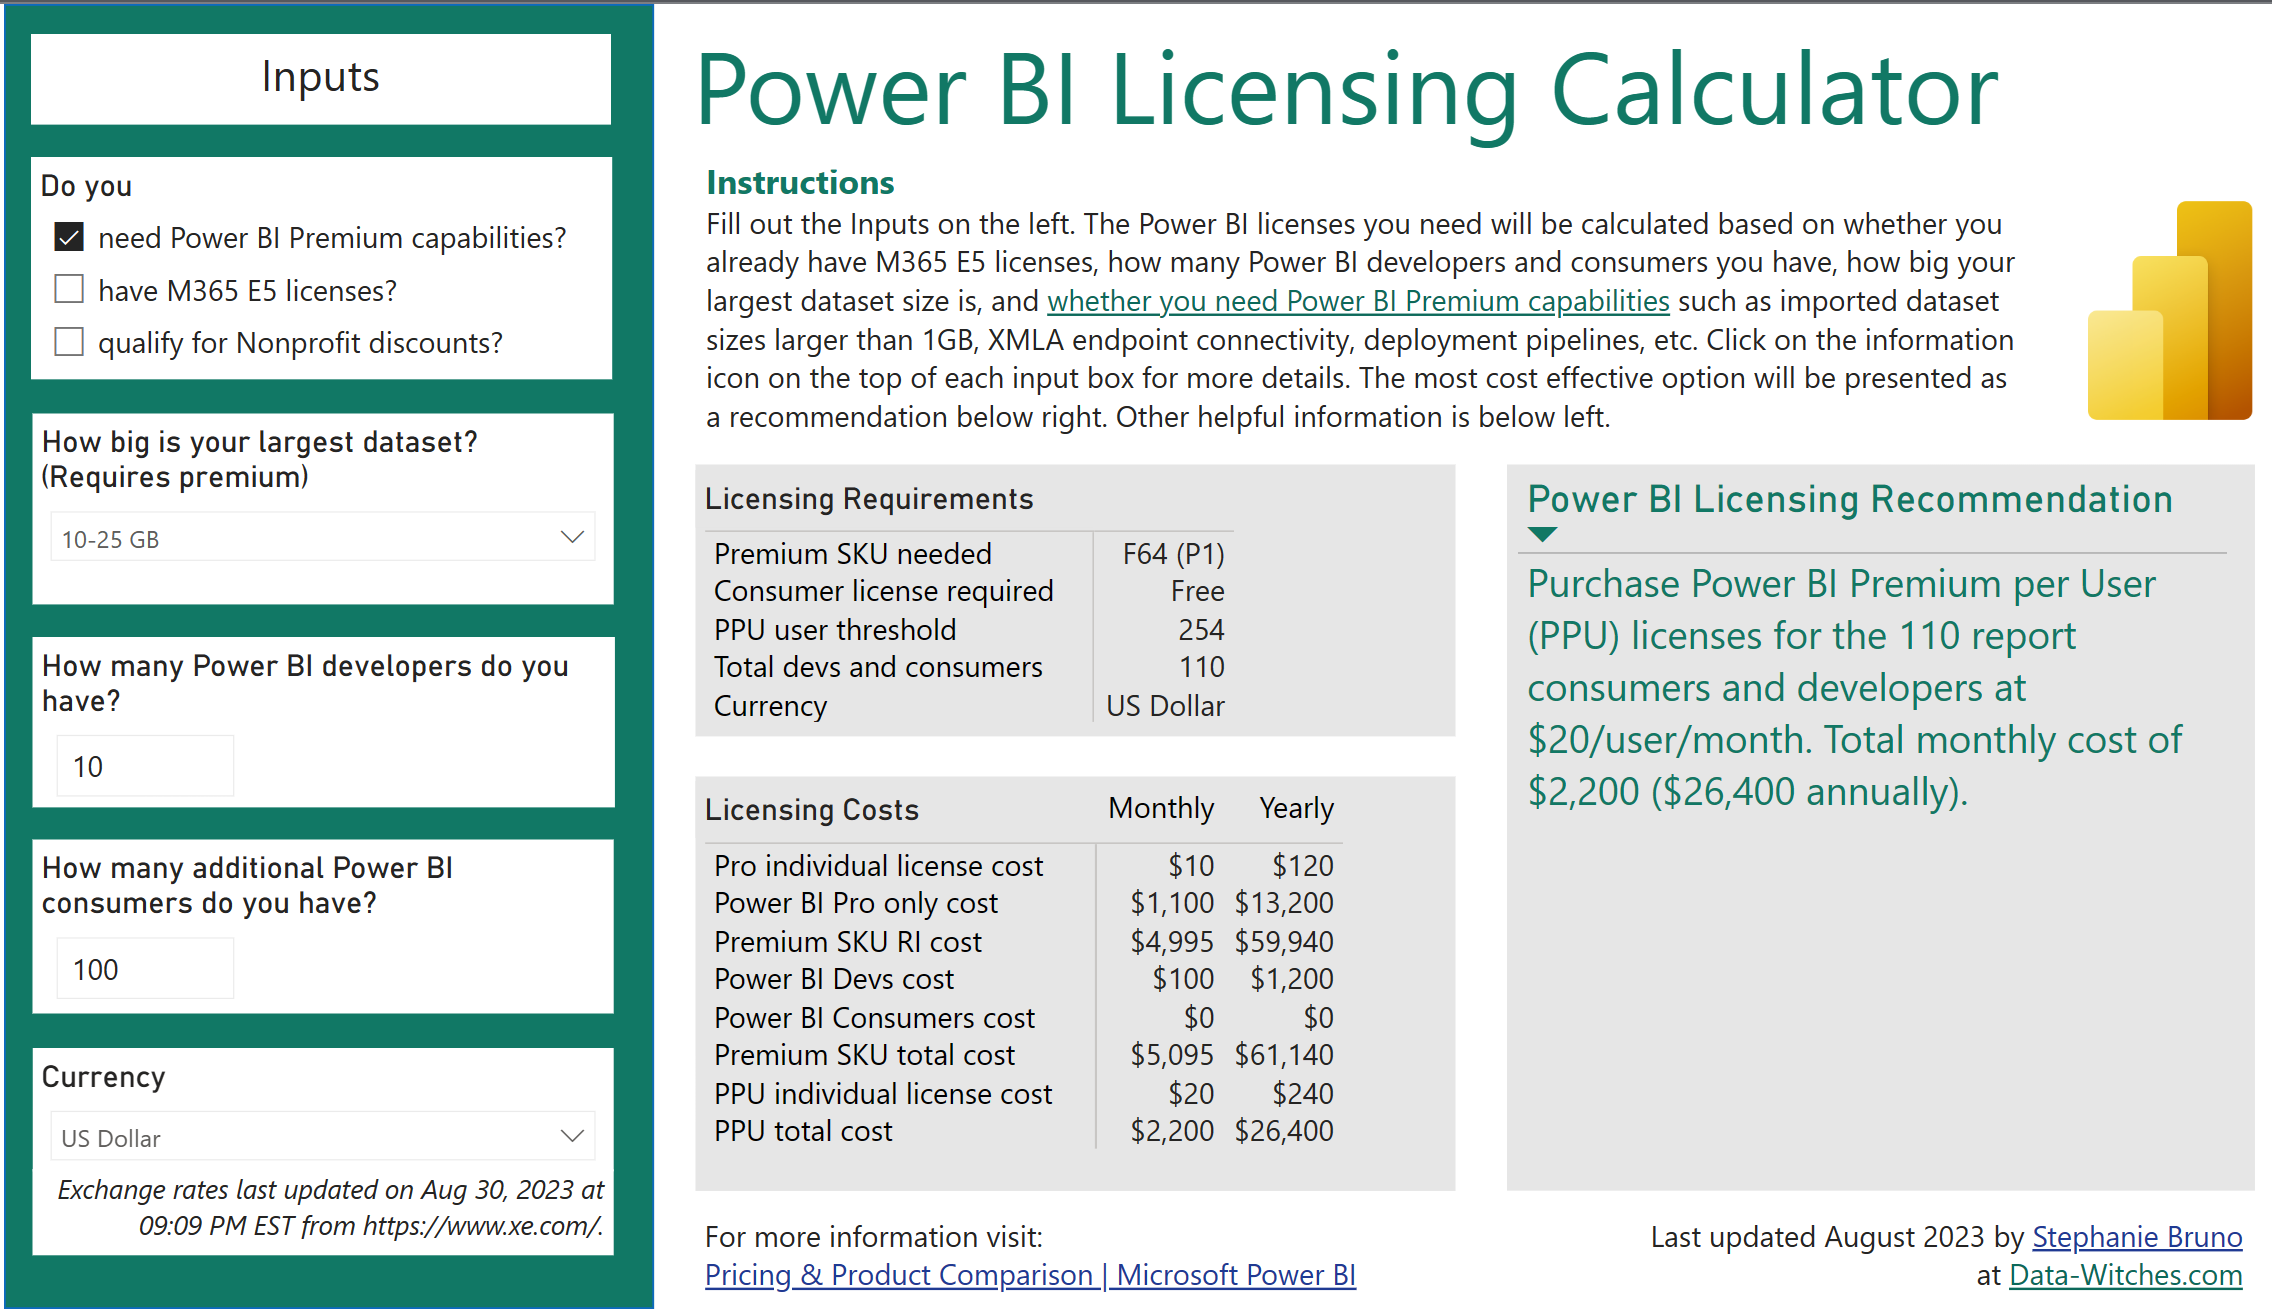
Figuring out what licensing model your organization should choose for your Power BI needs has always been a bit of a challenge, and now with Fabric it’s getting even more complicated. Choosing between using all Pro licenses, Premium Per User, or a dedicated capacity, based on factors like the number of developers and the number of content consumers, dataset sizes, etc. can result in some messy spreadsheets. To try and simplify these calculations, we’ve created the Power BI Licensing Calculator. Just enter the inputs and you’ll be provided with a licensing recommendation. Click here for a full screen version of…
: Power BI Licensing Calculator
-
Power BI Accessibility Checker
Read MoreCreating accessible Power BI reports isn’t just a nice-to-have feature, but a crucial aspect for ensuring all users can access and understand your data. Don’t let accessibility barriers hinder your audience – learn how to create inclusive reports that everyone can use! If you’re new to considering accessibility in Power BI, take a look at Meagan Longoria’s accessibility makeover challenge on the Workout Wednesday site. I built a new community tool, the Accessibility Checker, to help you ensure your reports meet basic accessibility requirements such as proper tab order, including alt text, and maintaining suitable color contrast ratios. Use the tool to check your .pbix…
: Power BI Accessibility Checker
-
Power BI datasets CI/CD (the easy-ish way)
 Read More
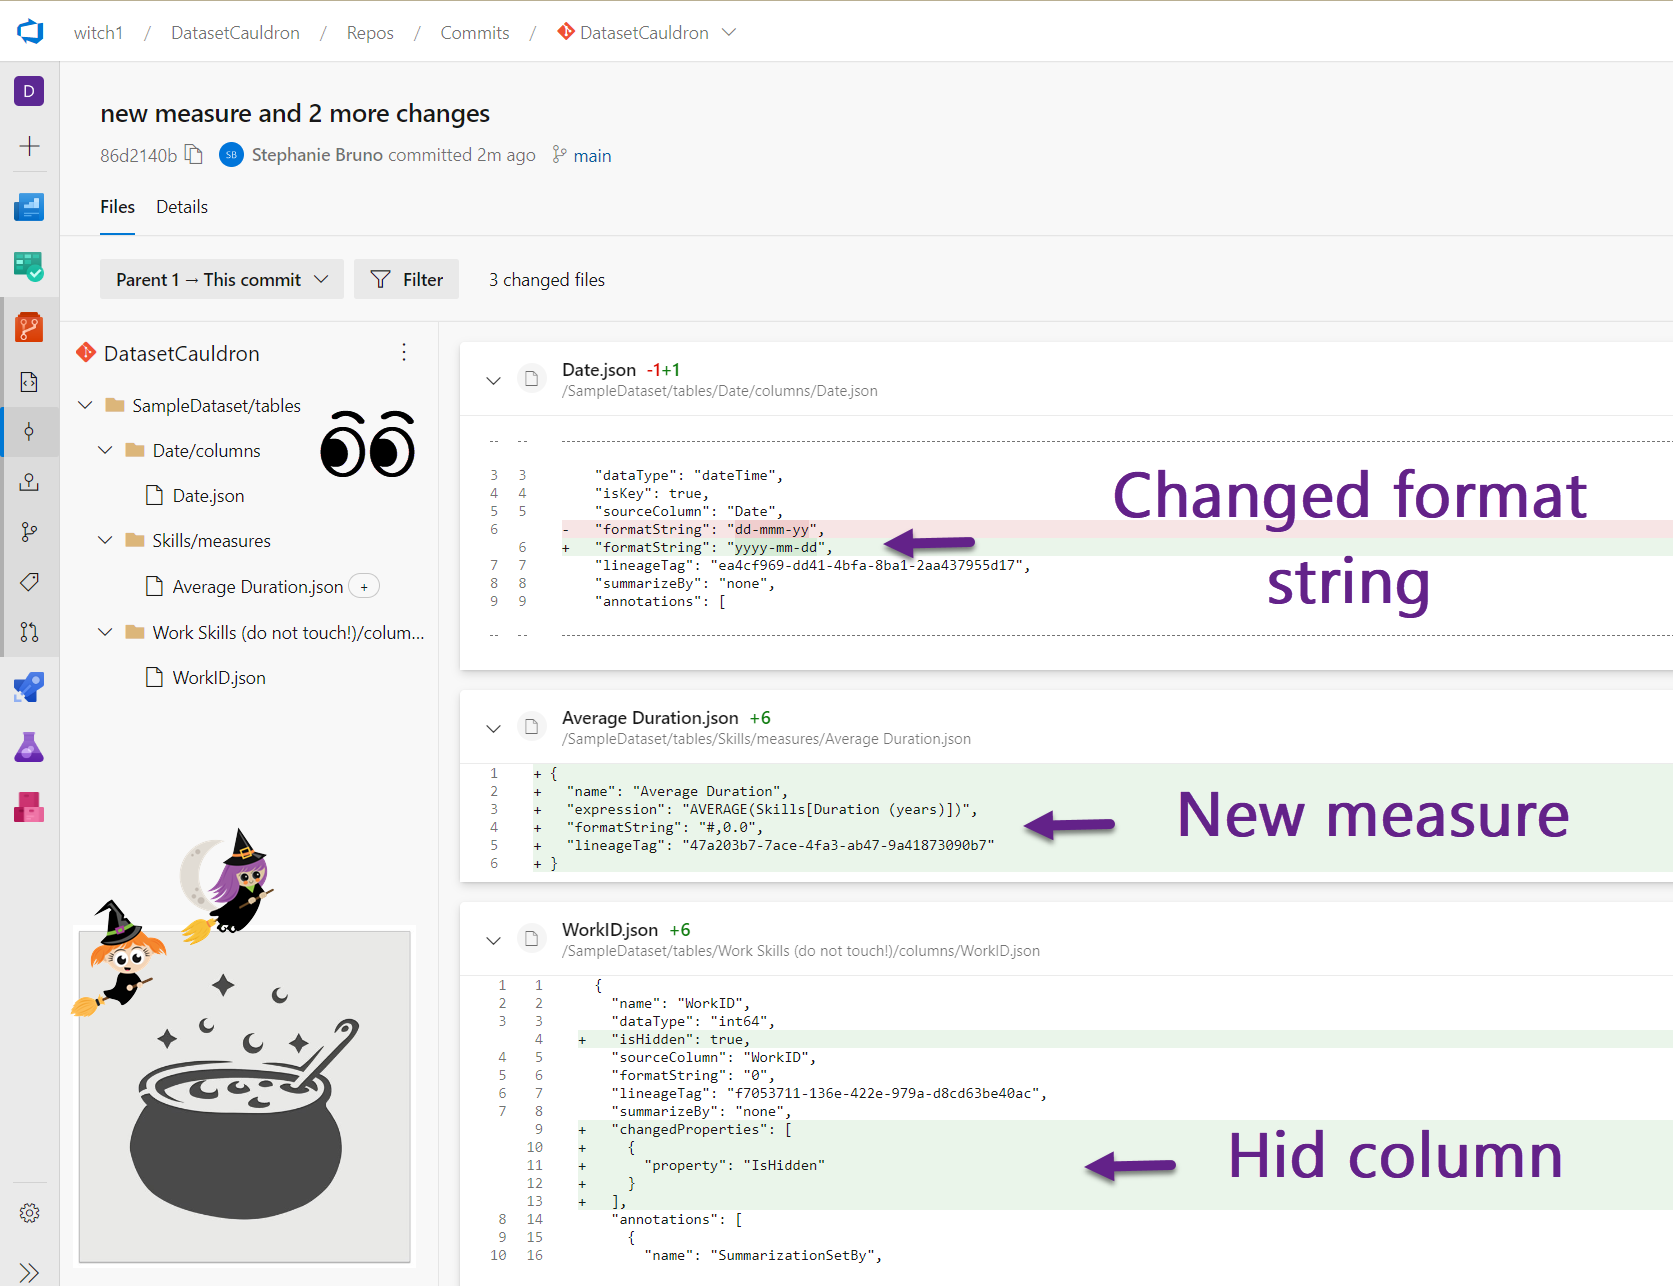
There’s a lot of information on how to get around the lack of an out-of-the box CI/CD solution for Power BI datasets, but for me it’s often complicated and I have to read too many pages before making much progress on my own. This post is here to strip it down and provide you with the easiest way we know to enable a bonafide CI/CD process for Power BI datasets with Azure DevOps. The post is still longer than we’d like, but it includes detailed step-by-step instructions to walk you through every part of the process. To save space, we…
: Power BI datasets CI/CD (the easy-ish way)
-
Learn Fabric for FREE with an M365 Developer License
Read MoreAre you interested in learning Power BI and/or testing out the brand new Microsoft Fabric (preview)? Do you want to do it outside of your corporate environment? We’ve got great news for you! You can sign-up for the Microsoft 365 Developer Program entirely for free, with no credit card needed! Our friends over at BIFocal made a video on this topic, so if you prefer to watch rather than read, check it out on YouTube! ***EDIT: As of May 21st, at Microsoft Build, a new trial experience was announced. Visit aka.ms/try-fabric to get started today with no credit card required!***…
: Learn Fabric for FREE with an M365 Developer License
-
When the Report Usage Metrics Report stops refreshing
Read MoreHave you ever had a Usage Metrics Report just stop refreshing? At the bottom you’ll see a little message that tells you to check the credentials. But you don’t have access to the Usage Metrics Report dataset in the list of datasets in the workspace because it’s hidden! So even if you wanted to delete it and nicely ask it to start again, you can’t do it from the workspace. What can you do? Well, you can delete the Usage Metrics Report dataset with the Power BI Rest API. First, start a Windows PowerShell session. Make sure that you have…
: When the Report Usage Metrics Report stops refreshing
-
Automatically Updating Word or PowerPoint with Power BI Data
Read MoreAs much as we try to convince our colleagues to do more of their work in Power BI and less and less in Excel and PowerPoint, we all know they’re going to smile and nod at us then go back to their desks and click “Export data” on our carefully developed Power BI visuals, open that file in Excel, and make their charts and tables in the tools they’re comfortable with. We may have some success in getting people to use our reports the way that nature intended, but we also have to accept that no matter what we do,…
: Automatically Updating Word or PowerPoint with Power BI Data
-
DAX measures treating slicer selections with *and* instead of *or* behavior
 Read More
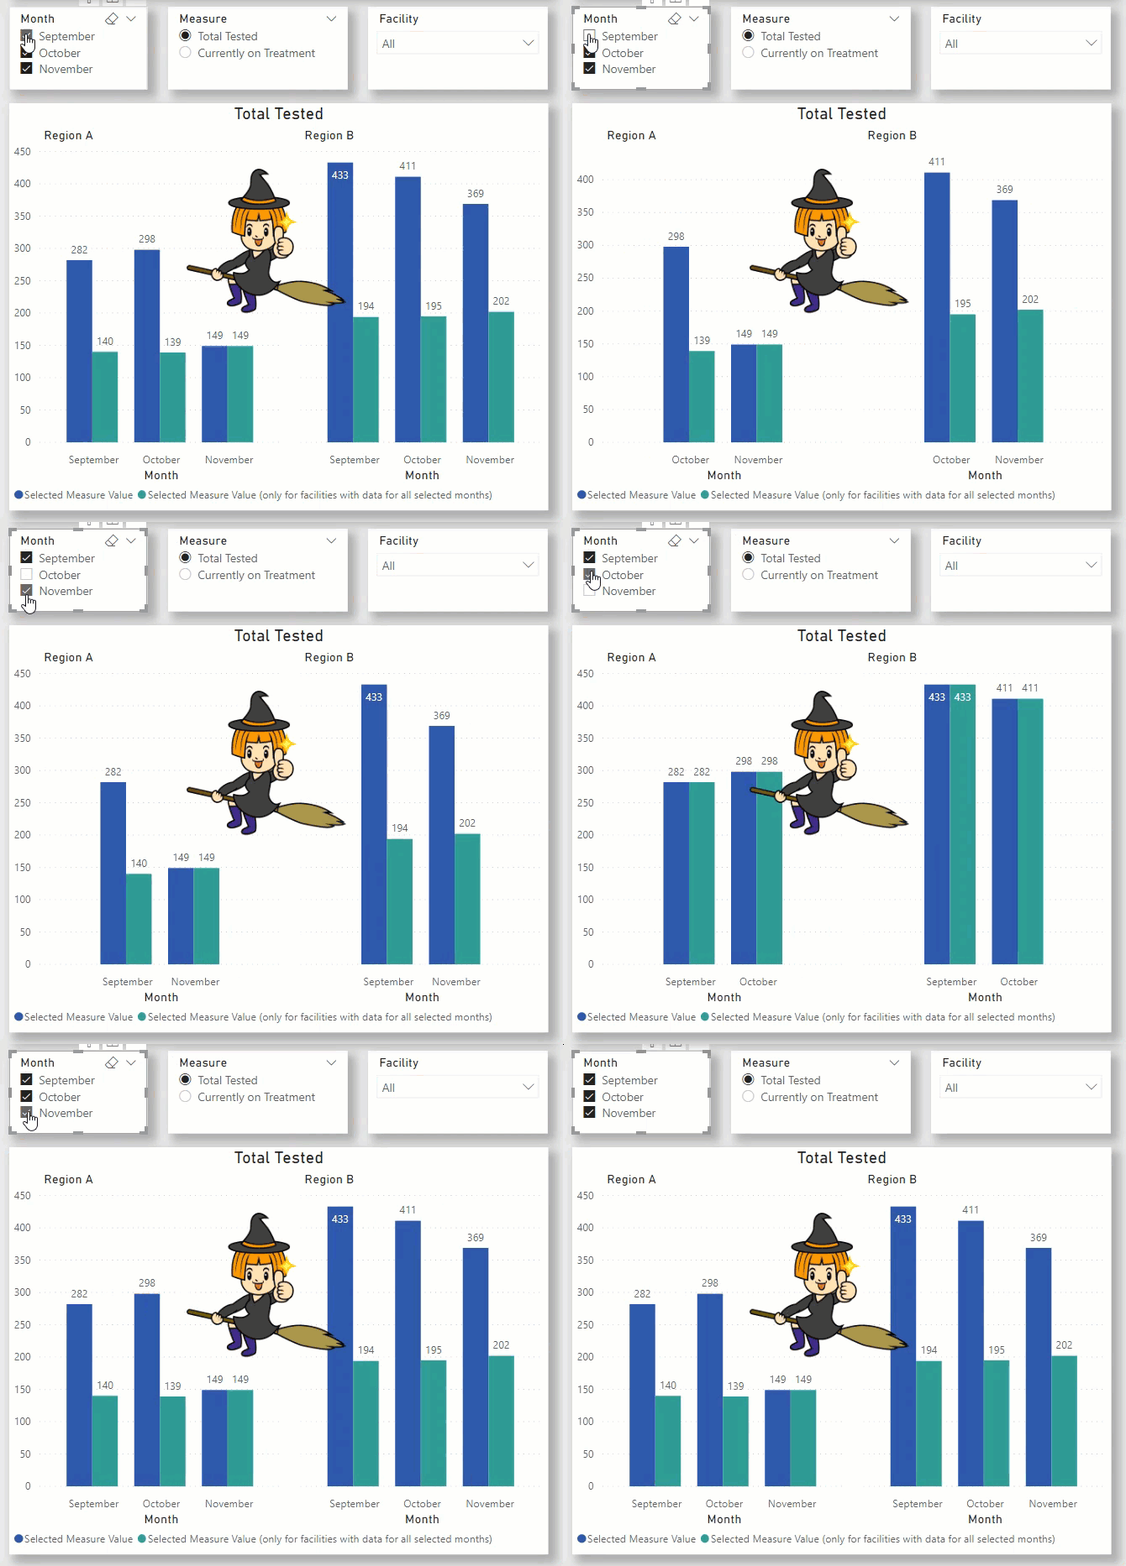
The general idea When using slicers in Power BI reports, multiple selections filter data with OR logic. For example, if you have a slicer with products and your visuals are displaying total number of invoices, then when “bicycles” and “helmets” are selected in the products slicer your visual will show the number of invoices that include bicycles OR helmets. But what if you need to have it instead only show the number of invoices that include bicycles AND helmets? Read on to find out how you can do just that with DAX. My specific problem You don’t need to read…
: DAX measures treating slicer selections with *and* instead of *or* behavior

BLOG