-
Power BI Field Finder
 Read More
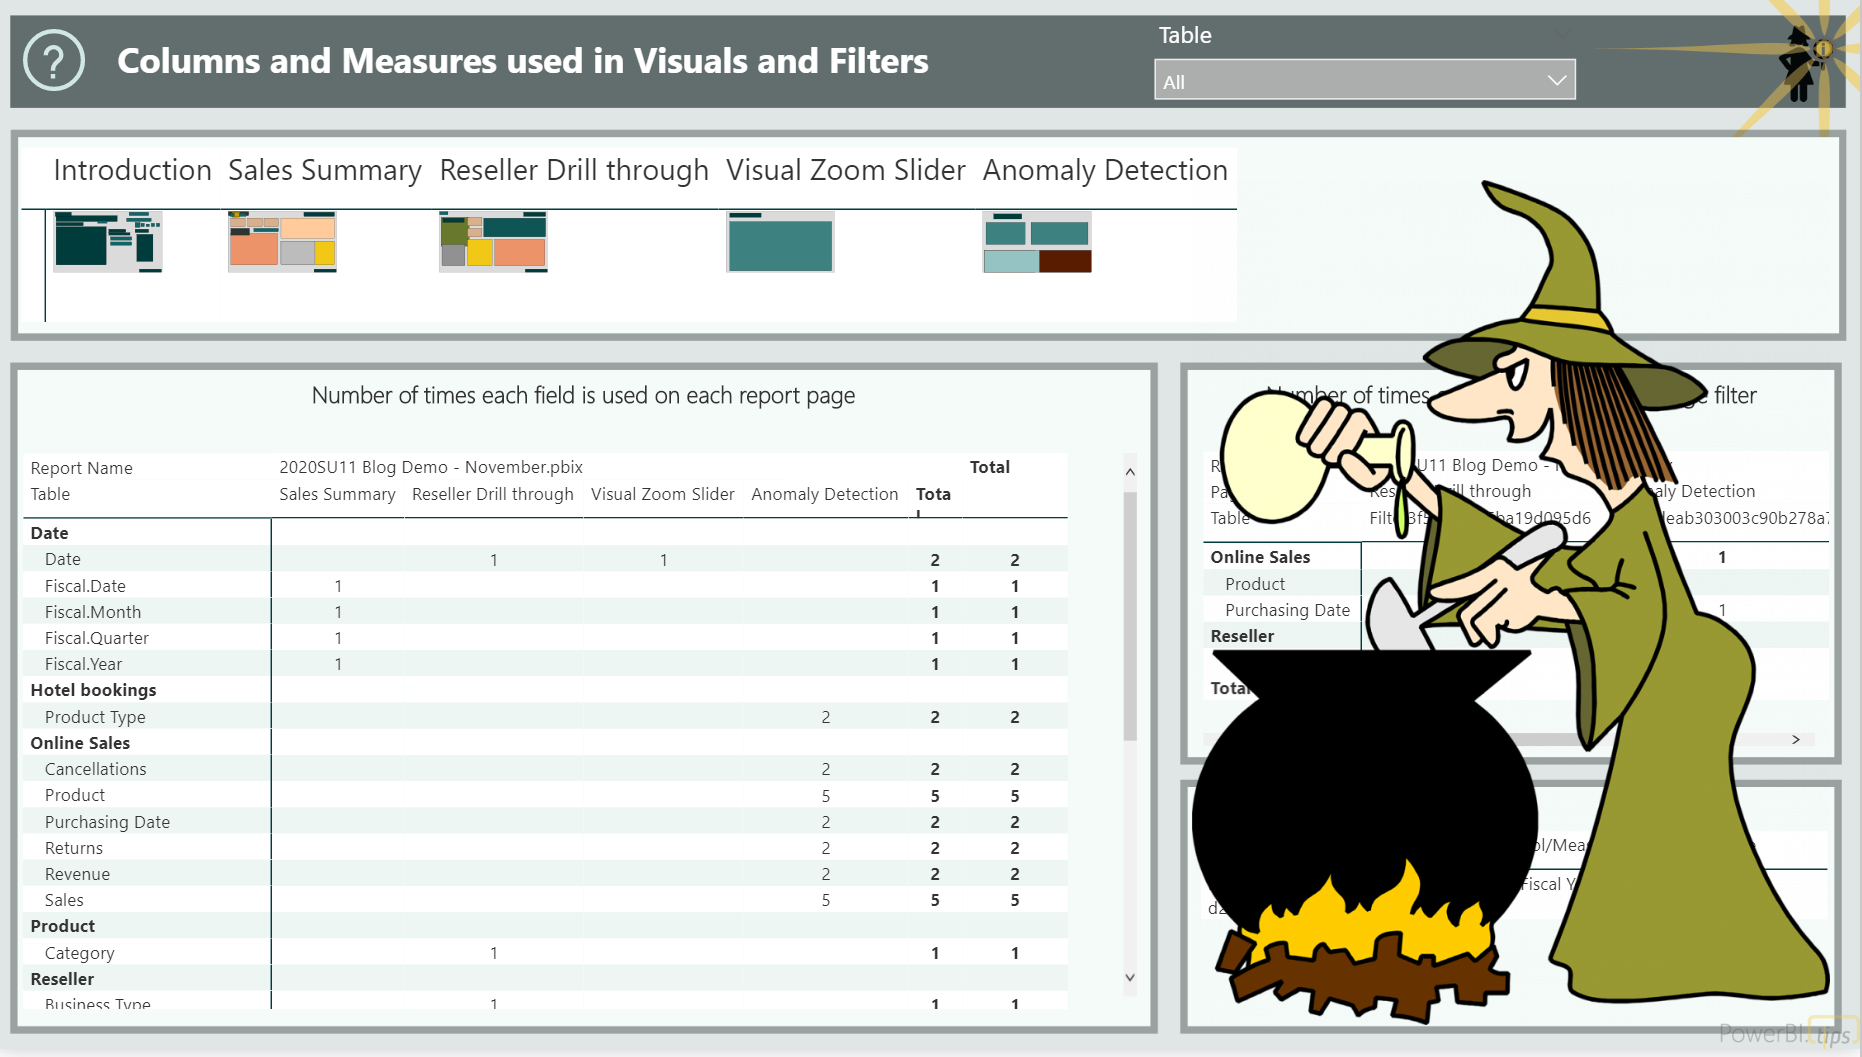
Have you ever wanted to know where a column or measure is actually being used in Power BI report visuals? Find out easily with the Power BI Field Finder!
 : Power BI Field Finder
-
My favorite clean and simple way to combine csv files in Power BI
Read MoreOne of the unsung heroes to me in Power BI desktop (or Power Query in Excel) is how wonderfully simple it is to combine csv or Excel files from a folder. Maybe it’s not totally unsung, but I think it’s an everyday problem that many people have to deal with. It could easily be an
: My favorite clean and simple way to combine csv files in Power BI
-
Collect/Analyze/Automate with the Power Platform
Read MoreStephanie and I are data people. We excel at taking loads of unstructured data and making it intelligible (see what I did there?!). Do we want to be working with unstructured data? Is Excel a data collection tool? Or better yet, is Excel a database? In theory the answer to all of these questions is
: Collect/Analyze/Automate with the Power Platform
-
Create an Interactive Legend in your Power BI Map
Read MoreMapping in Power BI can be super simple. Drop a field with a location in it, add a value, and you’re off to the races. Mapping in Power BI can also be challenging, and sometimes it takes a bit of trial and error to get a map close to what you want/need. This post is
: Create an Interactive Legend in your Power BI Map
-
Adding a row rank based on a different column with Power Query
Read MoreSuppose you have two columns of data, one is something to group on and the other is something you could use to rank the rows. It might look something like this (grouping on Person, ranking based on Event Date): Now let’s say that you’d like to use Power Query to add a column that ranks
: Adding a row rank based on a different column with Power Query
-
Using a Power BI perspective with Analyze in Excel
Read MoreAs of August 2020, perspectives can be used by your users when they are working with personalized visuals. Another place you may want to make use of the perspectives you define, though, is in Analyze in Excel.
: Using a Power BI perspective with Analyze in Excel
BLOG
