BLOG

Category: Power BI
-
Radar Chart Fun with SVGs – aka No Small Multiples No Problem!
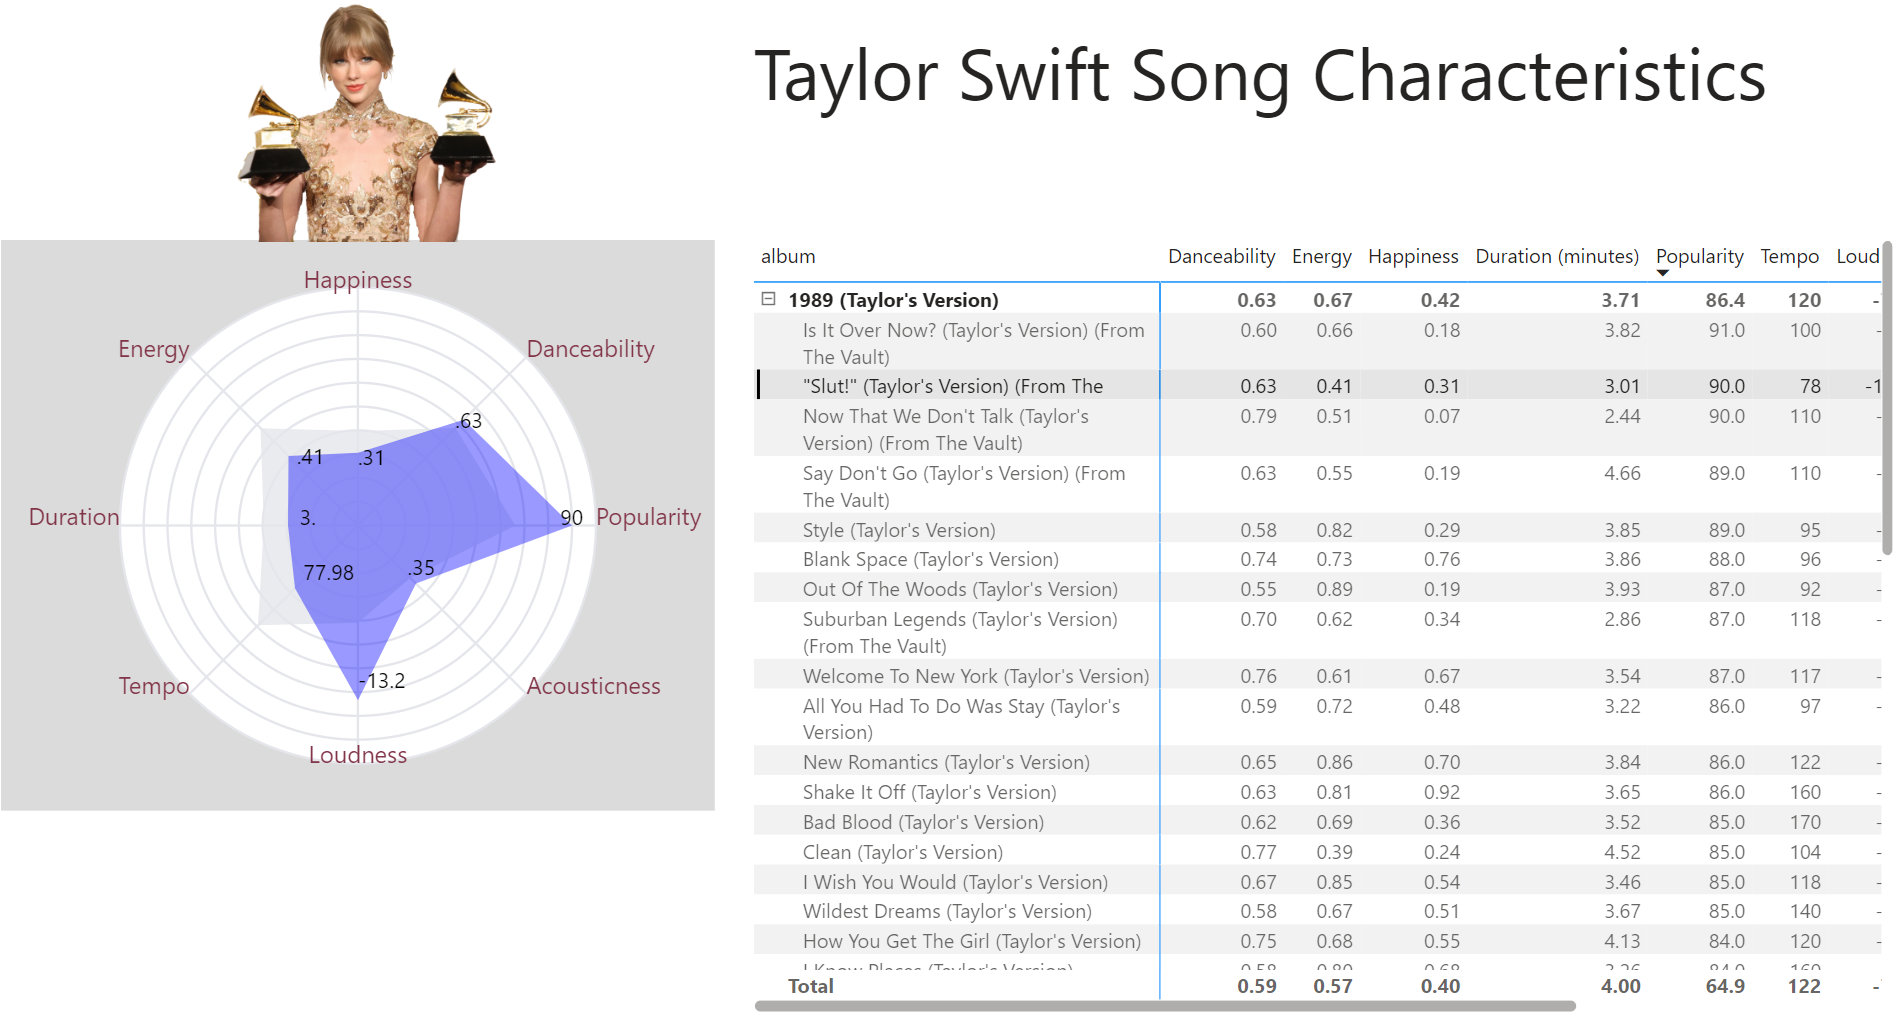
This week I got to be a guest contributor for the Workout Wednesday challenges for Power BI and used the opportunity to create a radar chart with SVG and display it in a matrix to simulate small multiples. You can download the solution file here. The Power BI core visuals are great and continually getting […]
-
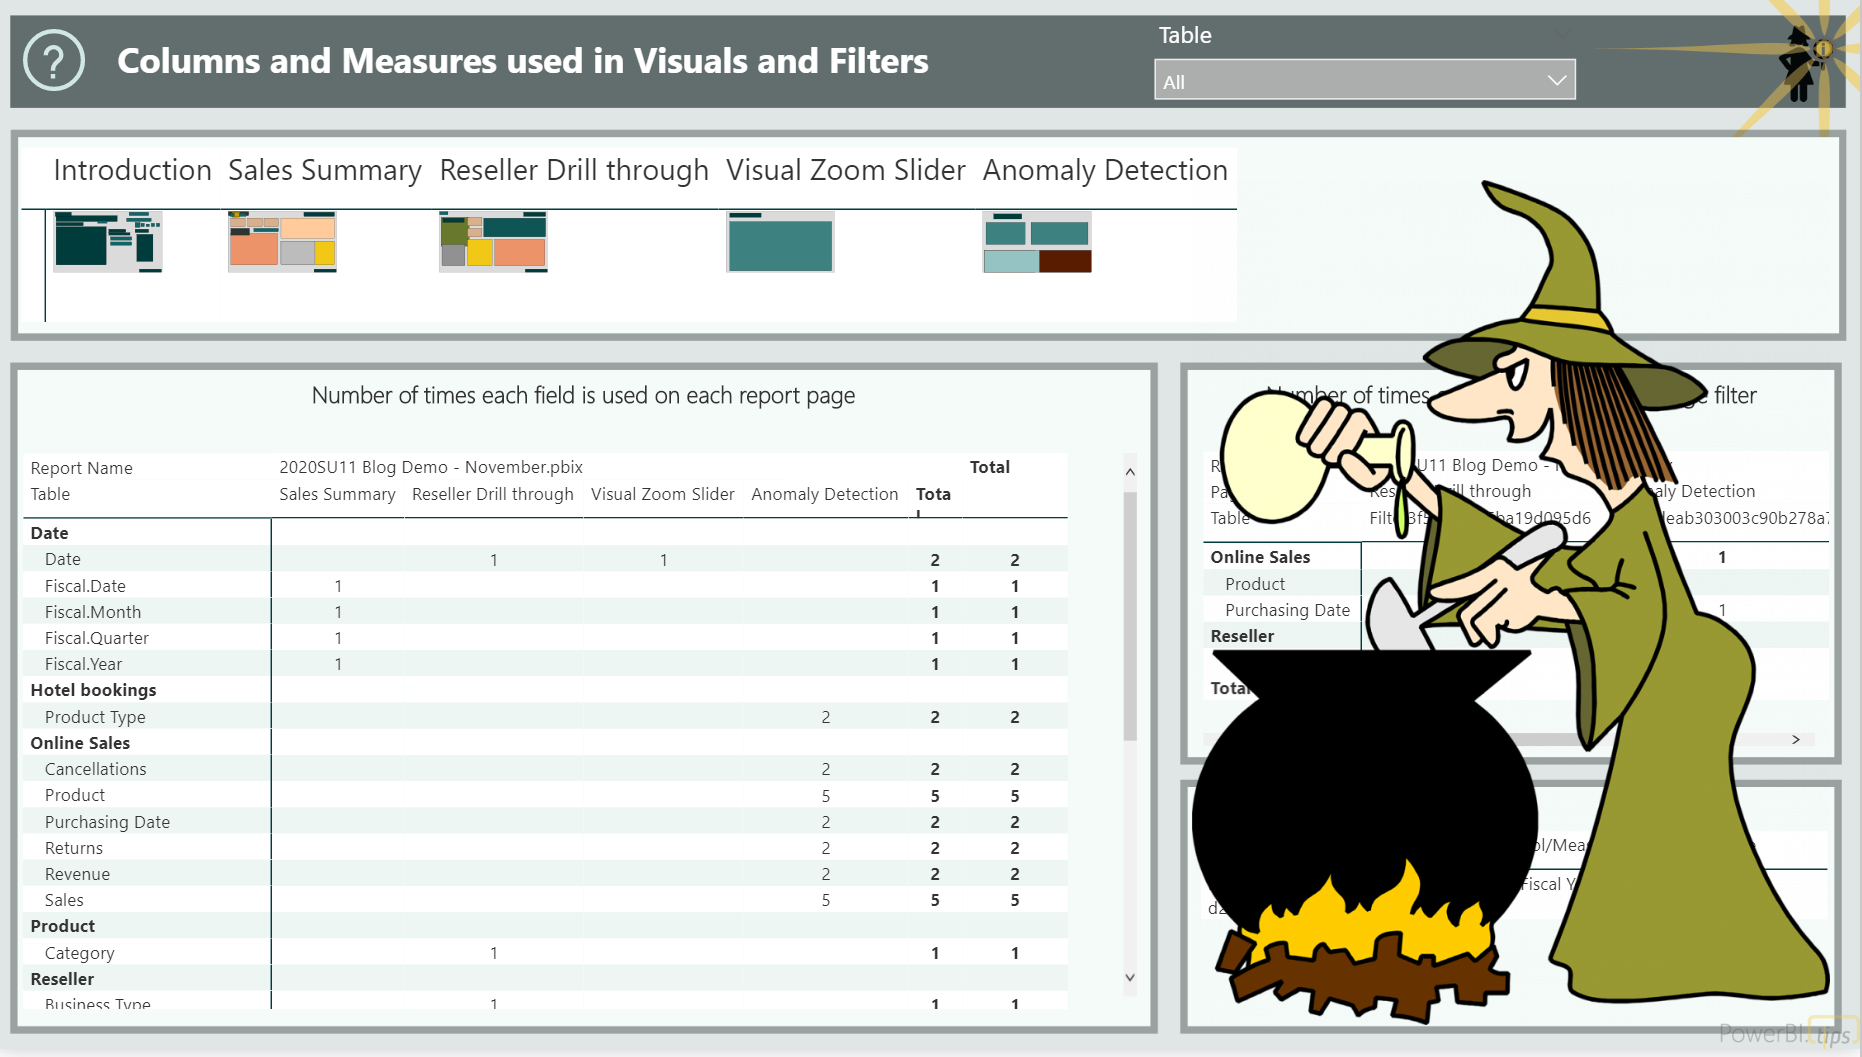
Power BI Field Finder – new and improved!
The Power BI Field Finder is a standalone .pbix file you can download and hook up to your reports and data model to. The Field Finder helps you visually analyze where fields are used in reports. I just updated and released a ✨brand new version✨ of the Field Finder that can now connect to a […]
-
Power BI Licensing Calculator
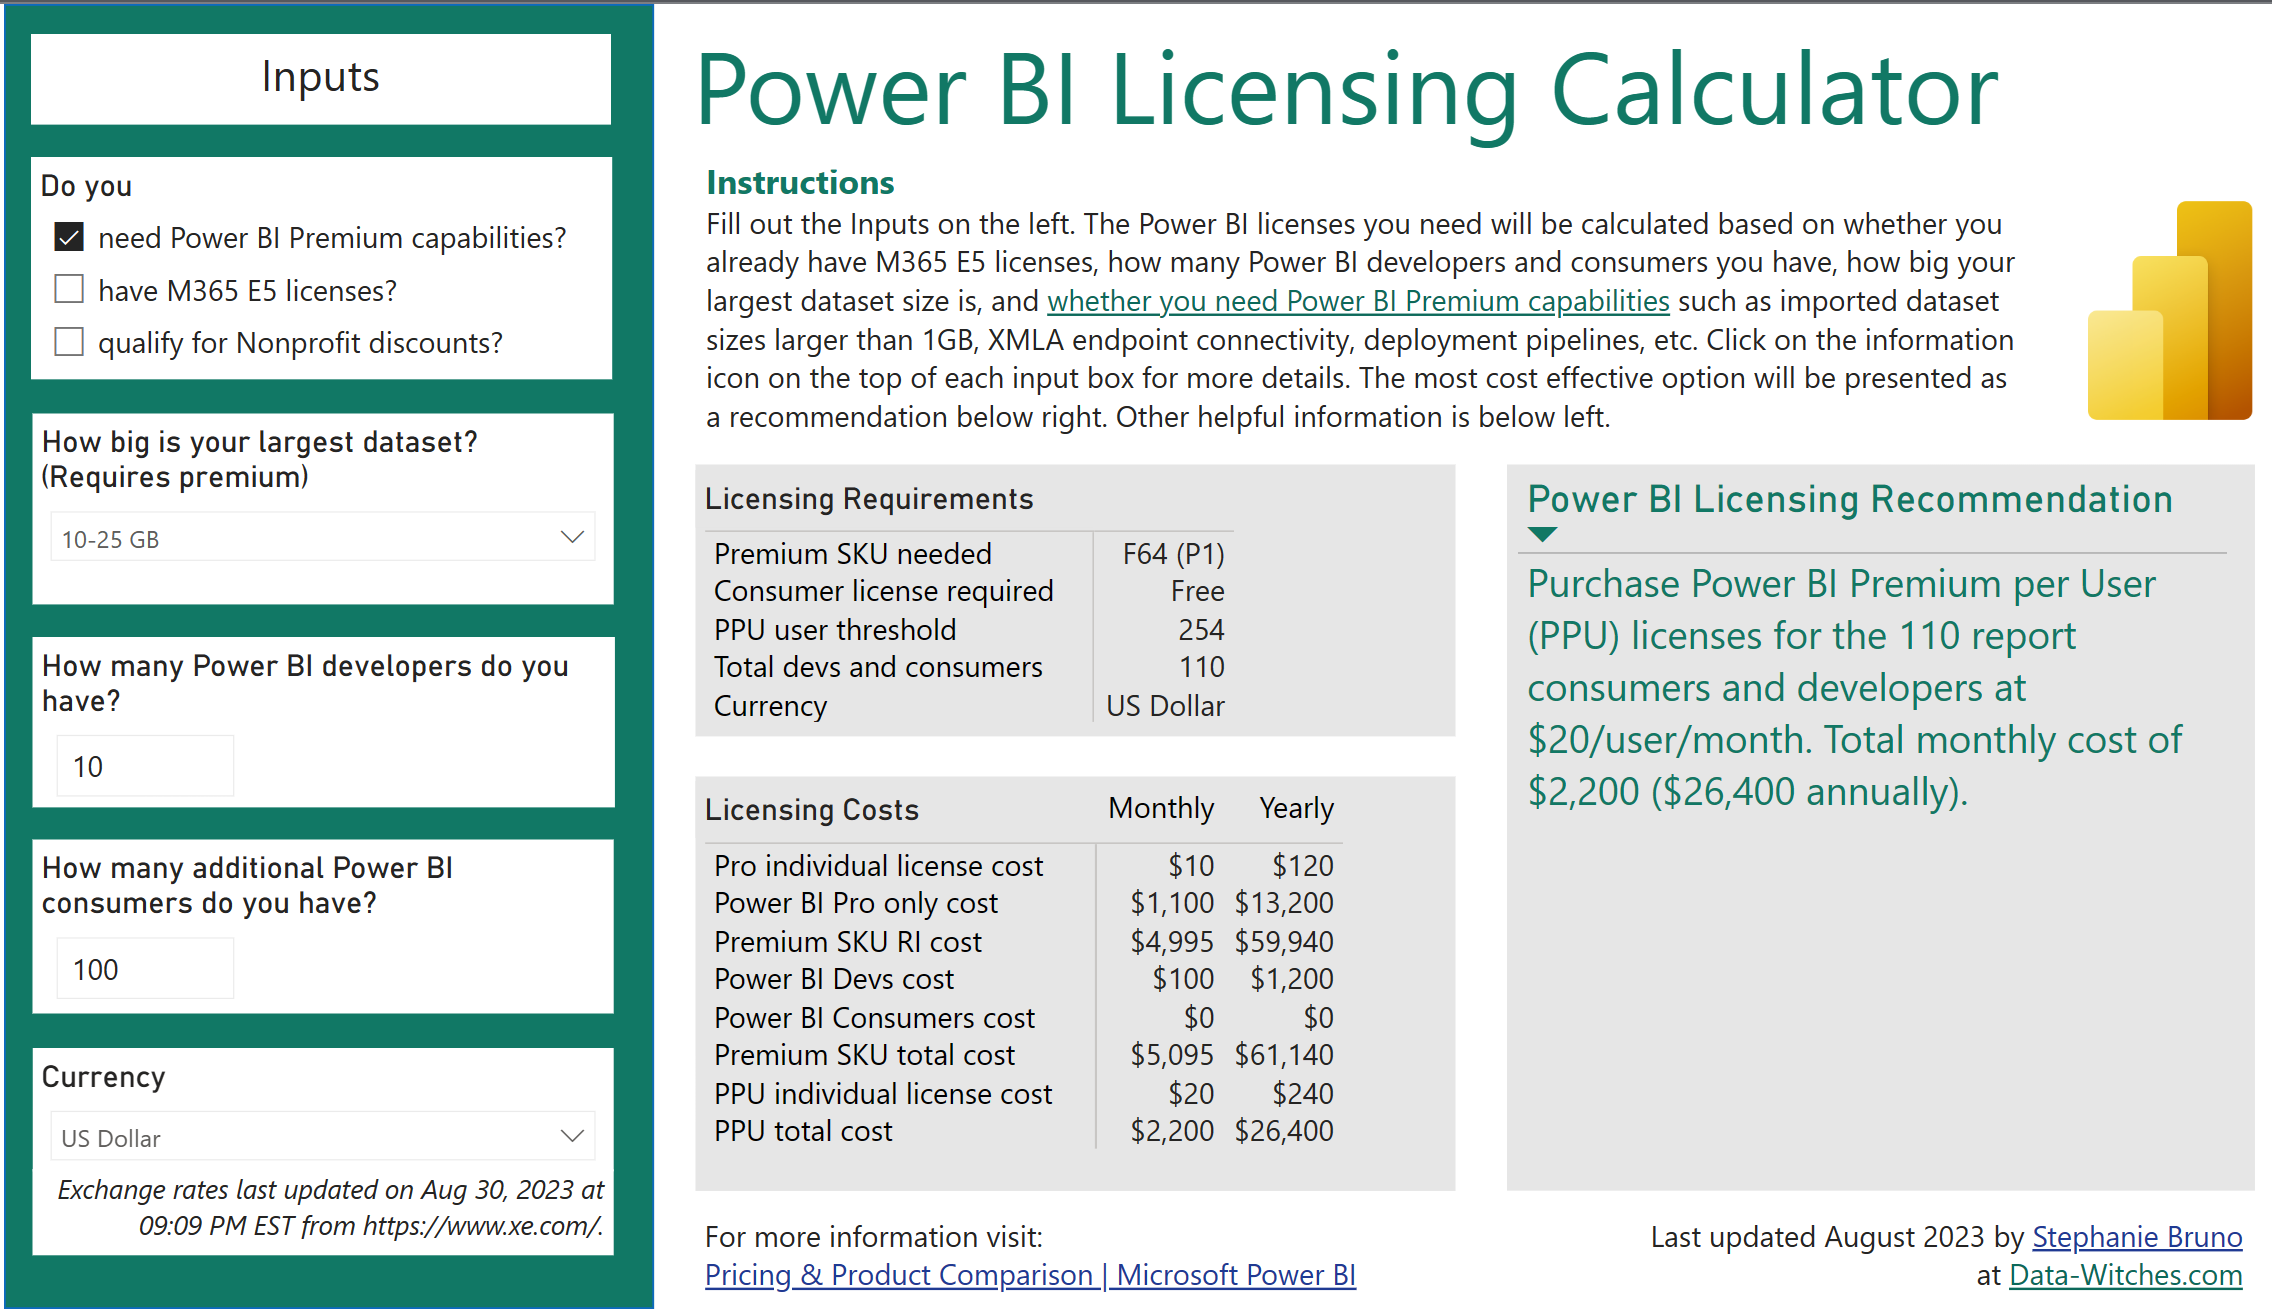
Figuring out what licensing model your organization should choose for your Power BI needs has always been a bit of a challenge, and now with Fabric it’s getting even more complicated. Choosing between using all Pro licenses, Premium Per User, or a dedicated capacity, based on factors like the number of developers and the number […]
-
Power BI Accessibility Checker
Creating accessible Power BI reports isn’t just a nice-to-have feature, but a crucial aspect for ensuring all users can access and understand your data. Don’t let accessibility barriers hinder your audience – learn how to create inclusive reports that everyone can use! If you’re new to considering accessibility in Power BI, take a look at […]
-
Power BI datasets CI/CD (the easy-ish way)
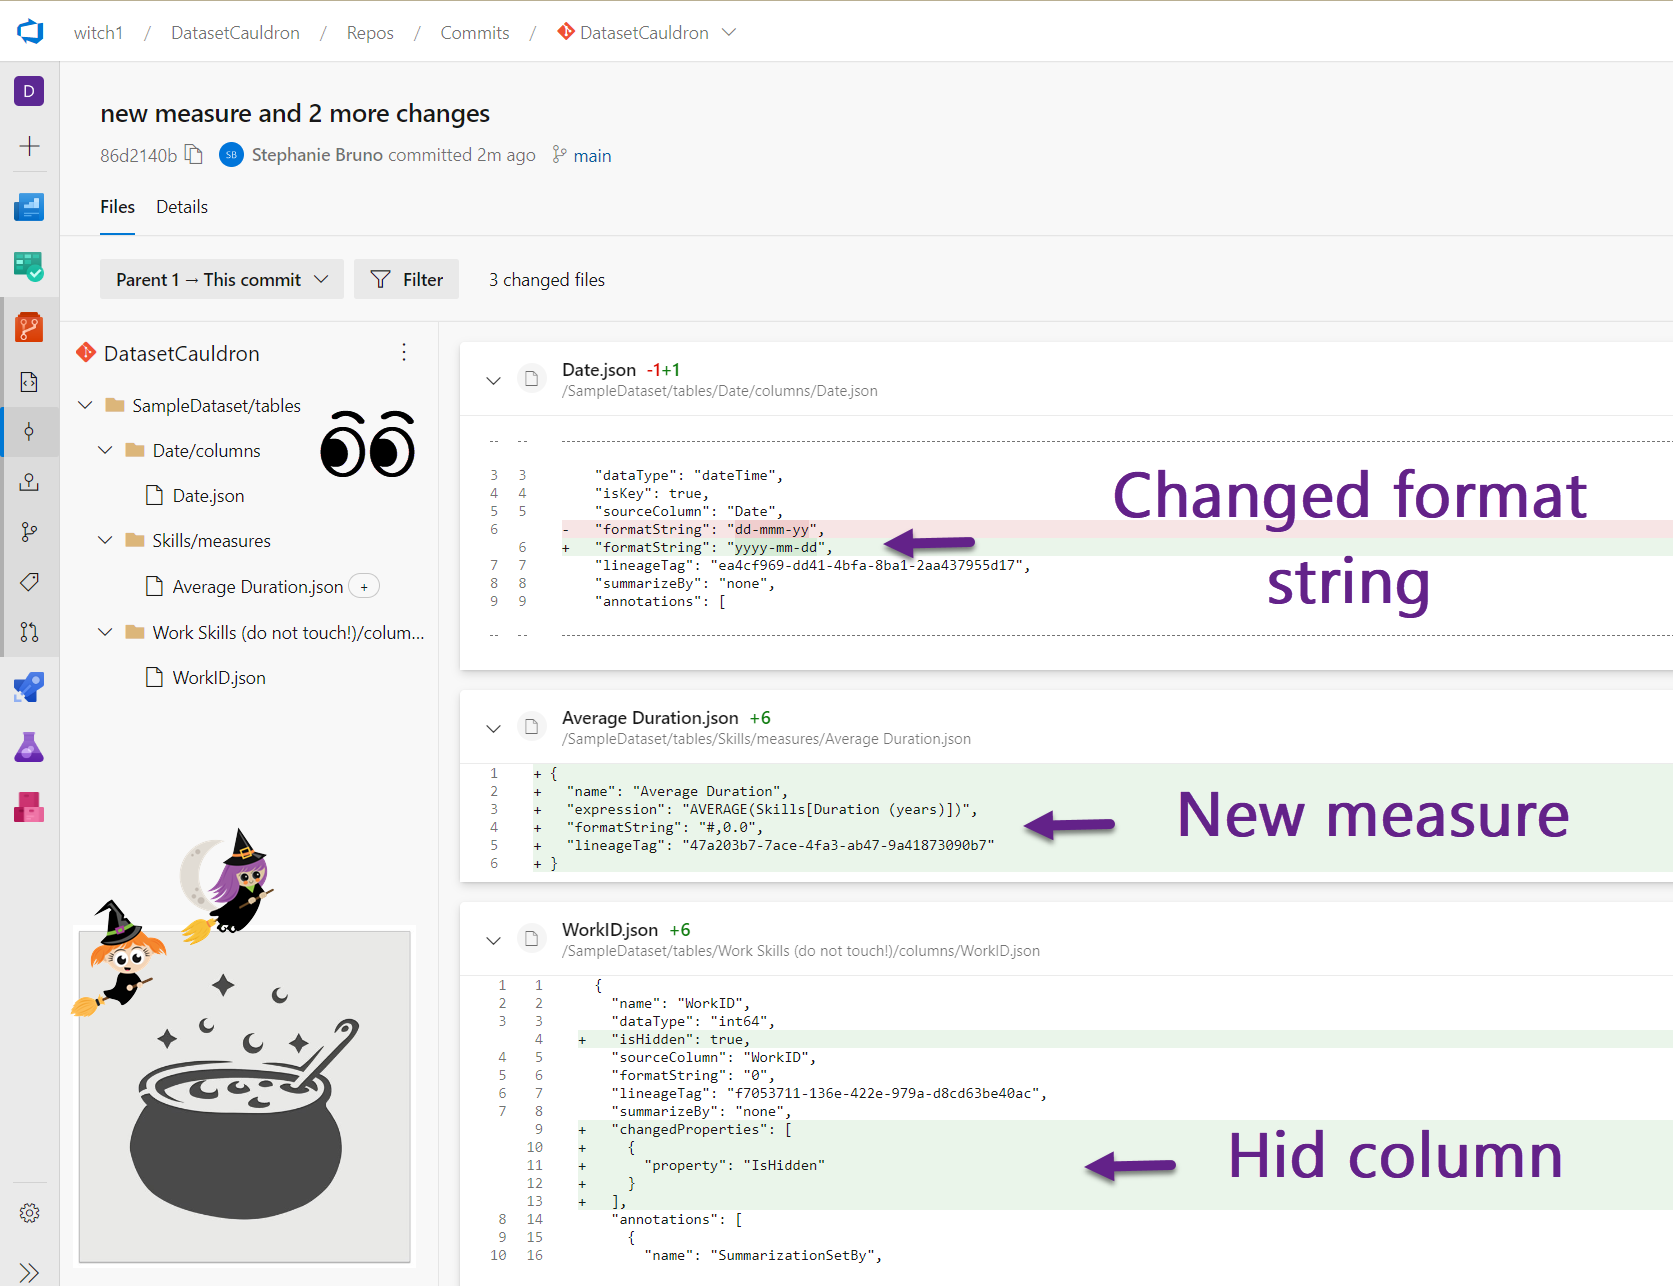
There’s a lot of information on how to get around the lack of an out-of-the box CI/CD solution for Power BI datasets, but for me it’s often complicated and I have to read too many pages before making much progress on my own. This post is here to strip it down and provide you with […]
-
When the Report Usage Metrics Report stops refreshing
Have you ever had a Usage Metrics Report just stop refreshing? At the bottom you’ll see a little message that tells you to check the credentials. But you don’t have access to the Usage Metrics Report dataset in the list of datasets in the workspace because it’s hidden! So even if you wanted to delete […]
-
Automatically Updating Word or PowerPoint with Power BI Data
As much as we try to convince our colleagues to do more of their work in Power BI and less and less in Excel and PowerPoint, we all know they’re going to smile and nod at us then go back to their desks and click “Export data” on our carefully developed Power BI visuals, open […]
-
DAX measures treating slicer selections with *and* instead of *or* behavior
The general idea When using slicers in Power BI reports, multiple selections filter data with OR logic. For example, if you have a slicer with products and your visuals are displaying total number of invoices, then when “bicycles” and “helmets” are selected in the products slicer your visual will show the number of invoices that […]
-
Power BI Field Finder
Have you ever wanted to know where a column or measure is actually being used in Power BI report visuals? Find out easily with the Power BI Field Finder!
-
My favorite clean and simple way to combine csv files in Power BI
One of the unsung heroes to me in Power BI desktop (or Power Query in Excel) is how wonderfully simple it is to combine csv or Excel files from a folder. Maybe it’s not totally unsung, but I think it’s an everyday problem that many people have to deal with. It could easily be an […]