BLOG

Tag: Power BI
-
Power BI Licensing Calculator
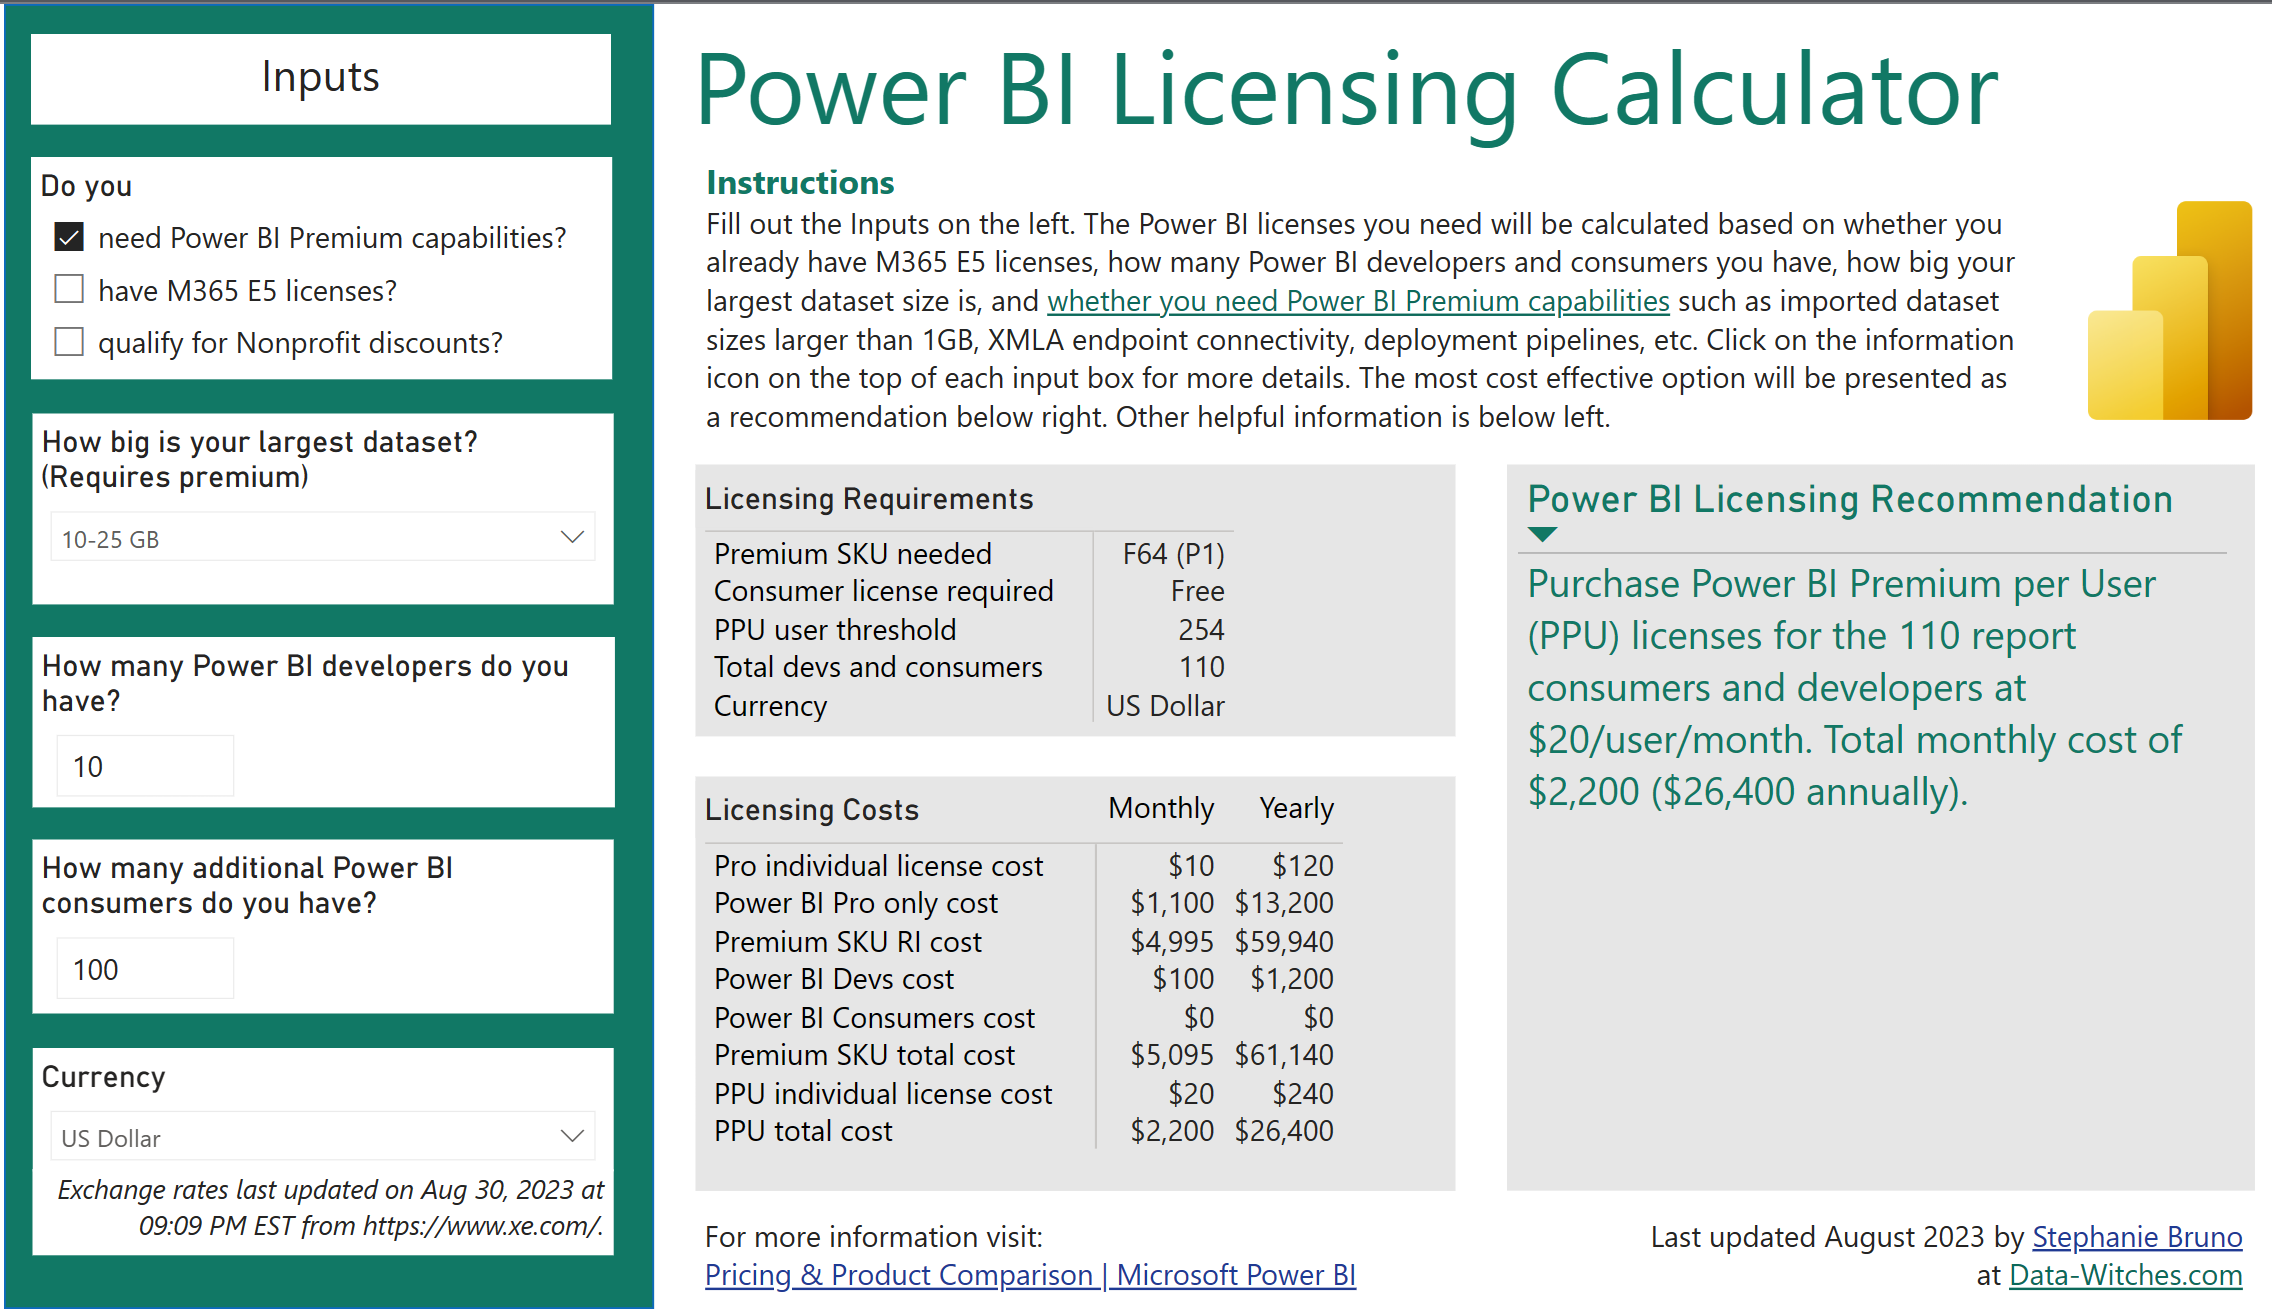
Figuring out what licensing model your organization should choose for your Power BI needs has always been a bit of a challenge, and now with Fabric it’s getting even more complicated. Choosing between using all Pro licenses, Premium Per User, or a dedicated capacity, based on factors like the number of developers and the number […]
-
Power BI datasets CI/CD (the easy-ish way)
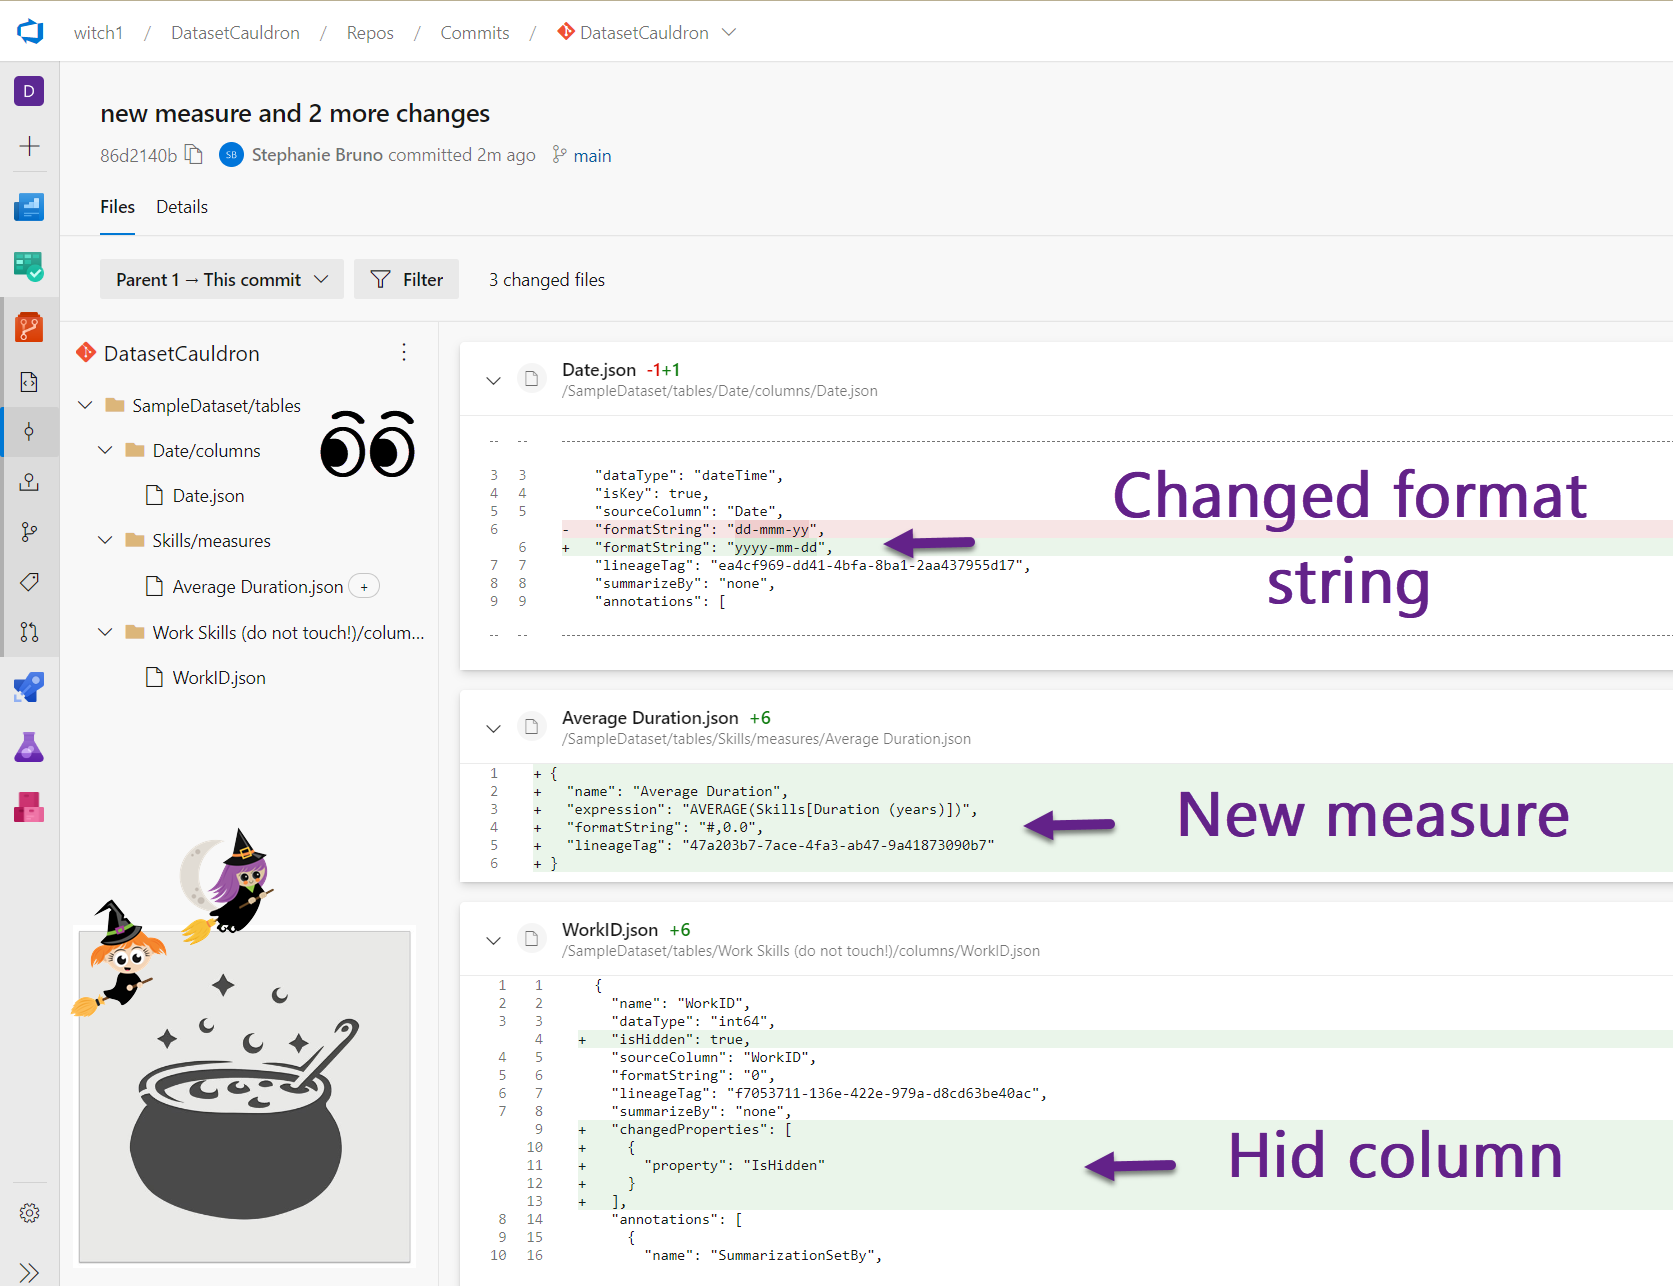
There’s a lot of information on how to get around the lack of an out-of-the box CI/CD solution for Power BI datasets, but for me it’s often complicated and I have to read too many pages before making much progress on my own. This post is here to strip it down and provide you with […]
-
Learn Fabric for FREE with an M365 Developer License
Are you interested in learning Power BI and/or testing out the brand new Microsoft Fabric (preview)? Do you want to do it outside of your corporate environment? We’ve got great news for you! You can sign-up for the Microsoft 365 Developer Program entirely for free, with no credit card needed! Our friends over at BIFocal […]
-
When the Report Usage Metrics Report stops refreshing
Have you ever had a Usage Metrics Report just stop refreshing? At the bottom you’ll see a little message that tells you to check the credentials. But you don’t have access to the Usage Metrics Report dataset in the list of datasets in the workspace because it’s hidden! So even if you wanted to delete […]
-
DAX measures treating slicer selections with *and* instead of *or* behavior
The general idea When using slicers in Power BI reports, multiple selections filter data with OR logic. For example, if you have a slicer with products and your visuals are displaying total number of invoices, then when “bicycles” and “helmets” are selected in the products slicer your visual will show the number of invoices that […]
-
Power BI Field Finder
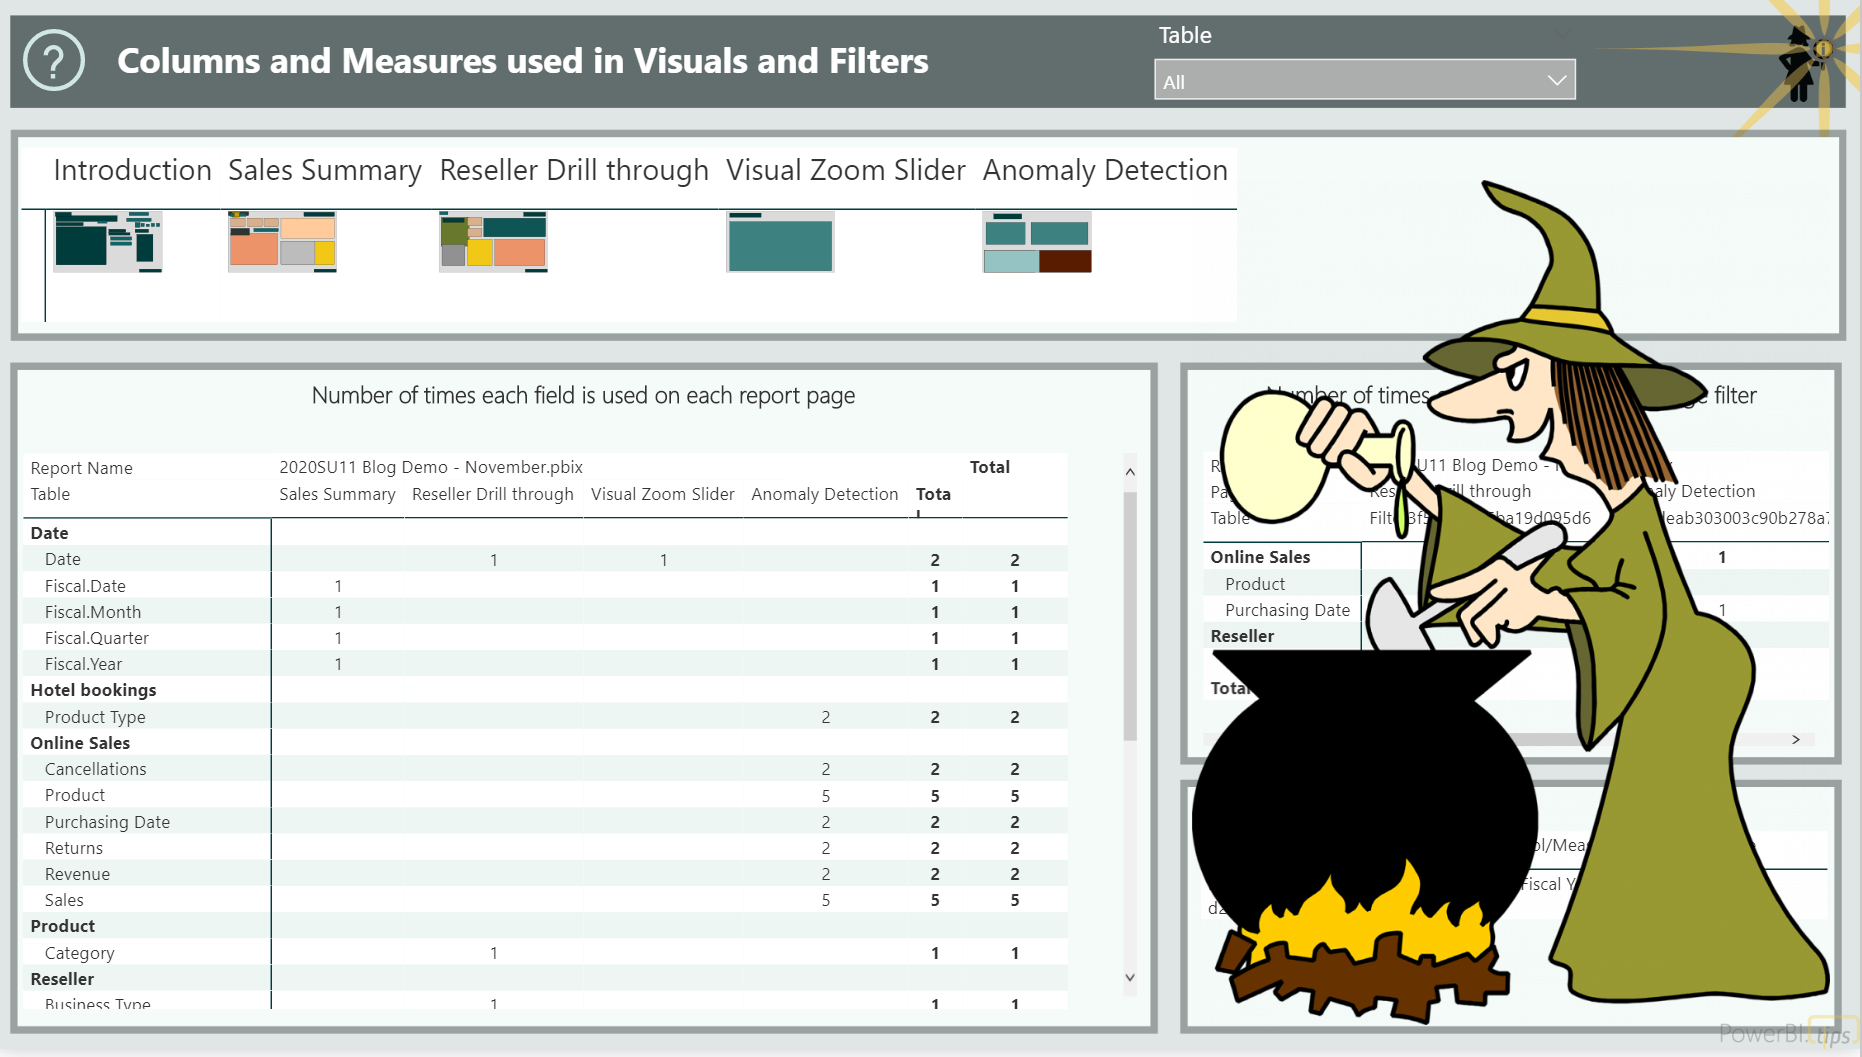
Have you ever wanted to know where a column or measure is actually being used in Power BI report visuals? Find out easily with the Power BI Field Finder!
-
Collect/Analyze/Automate with the Power Platform
Stephanie and I are data people. We excel at taking loads of unstructured data and making it intelligible (see what I did there?!). Do we want to be working with unstructured data? Is Excel a data collection tool? Or better yet, is Excel a database? In theory the answer to all of these questions is […]
-
Create an Interactive Legend in your Power BI Map
Mapping in Power BI can be super simple. Drop a field with a location in it, add a value, and you’re off to the races. Mapping in Power BI can also be challenging, and sometimes it takes a bit of trial and error to get a map close to what you want/need. This post is […]
-
Adding a row rank based on a different column with Power Query
Suppose you have two columns of data, one is something to group on and the other is something you could use to rank the rows. It might look something like this (grouping on Person, ranking based on Event Date): Now let’s say that you’d like to use Power Query to add a column that ranks […]
-
Using a Power BI perspective with Analyze in Excel
As of August 2020, perspectives can be used by your users when they are working with personalized visuals. Another place you may want to make use of the perspectives you define, though, is in Analyze in Excel.